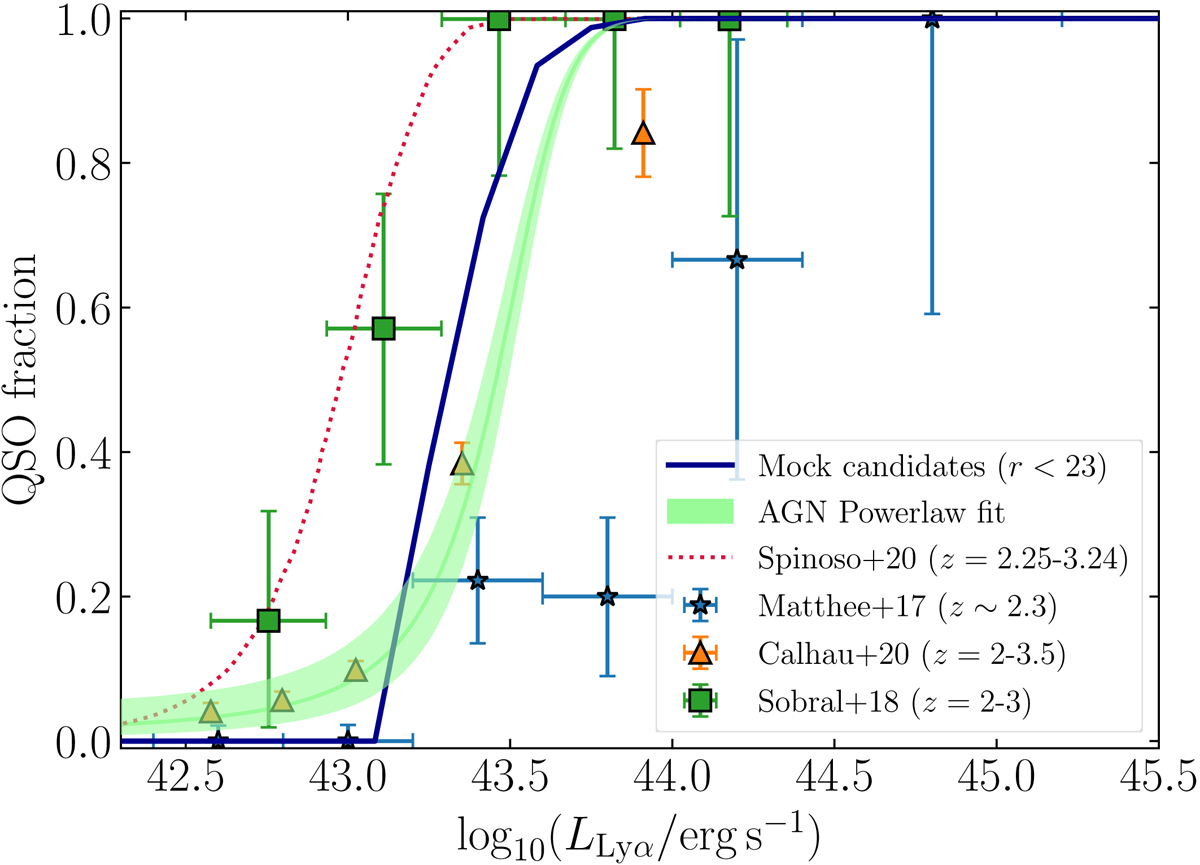
Fig. 15.
Download original image
Fraction of QSOs in the candidate sample from the mock at 2.05 < z < 3.75. We represent our estimation of the QSO fraction (green solid line and green shaded area for 1σ uncertainty) based on the power-law fit to our Lyα LF and the SFG Lyα LF of Sobral et al. (2018). We also show the QSO fraction extracted from our mocks (blue solid line). We compare our results to previous realizations from past works.
Current usage metrics show cumulative count of Article Views (full-text article views including HTML views, PDF and ePub downloads, according to the available data) and Abstracts Views on Vision4Press platform.
Data correspond to usage on the plateform after 2015. The current usage metrics is available 48-96 hours after online publication and is updated daily on week days.
Initial download of the metrics may take a while.