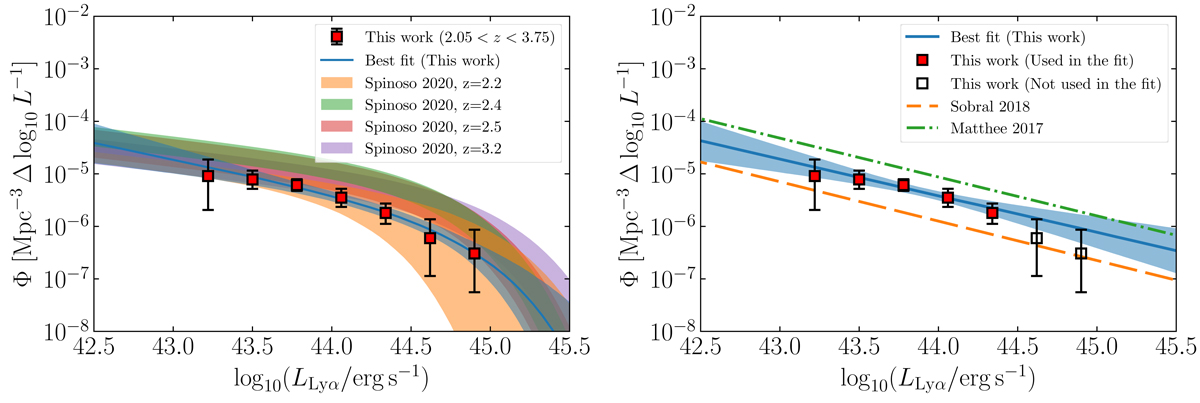
Fig. 14.
Download original image
Schechter and power-law fits of the 2.05 < z < 3.75 Lyα LF. Left panel: Schechter best fit and 1σ confidence region for the fit of the full z range of this work (blue solid line and shaded area). We compare our result with the Schechter fits in Spinoso et al. (2020) for 4 NBs of J-PLUS. Our Schechter fit is in line with the fits in Spinoso et al. (2020) for z = 2.2, 2.5 and 3.2 at the faintest bins of our LF. We advise some caution when considering our results at the brightest luminosity (i.e., log10(LLyα/erg s−1) > 45.5). Indeed our results in this regime are limited by our survey area. Right panel: power-law fit to our Lyα LF at log10(LLyα/erg s−1) < 45.5. The bins of the LF represented with empty squares are not used in this fit in particular. We compare to the power-law fits in Matthee et al. (2017), Sobral et al. (2018) in the same LLyα regime. The shaded blue area marks the 1σ confidence region. Our constraint on the power-law slope A for the faint-end of the AGN Lyα LF is consistent with the other realizations shown in this plot within a 1σ confidence interval.
Current usage metrics show cumulative count of Article Views (full-text article views including HTML views, PDF and ePub downloads, according to the available data) and Abstracts Views on Vision4Press platform.
Data correspond to usage on the plateform after 2015. The current usage metrics is available 48-96 hours after online publication and is updated daily on week days.
Initial download of the metrics may take a while.