Fig. 10.
Download original image
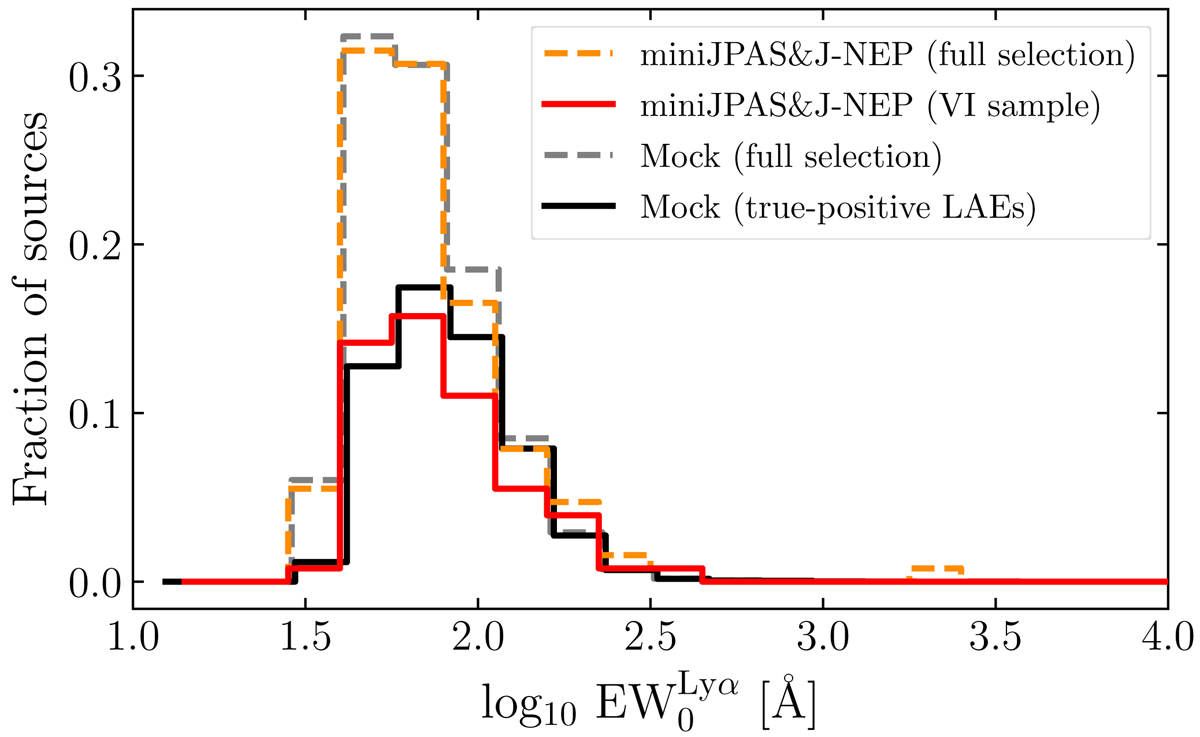
Distribution of Lyα EW0 of the candidate sample of miniJPAS and J-NEP. We compare the whole sample of candidates retrieved by our method in the mock (gray, dashed histogram) and in the observational data (orange, dashed histogram). We also compare the distribution of Lyα EW0 for the mock subsample of true-positive LAEs (solid, black histogram) and the visually inspected subsample of miniJPAS and J-NEP (solid, red histogram) as defined in Sect. 4.11. For ![]() , more than a 90% of the sources retrieved from the mock are true LAEs.
, more than a 90% of the sources retrieved from the mock are true LAEs.
Current usage metrics show cumulative count of Article Views (full-text article views including HTML views, PDF and ePub downloads, according to the available data) and Abstracts Views on Vision4Press platform.
Data correspond to usage on the plateform after 2015. The current usage metrics is available 48-96 hours after online publication and is updated daily on week days.
Initial download of the metrics may take a while.