Fig. 1
Download original image
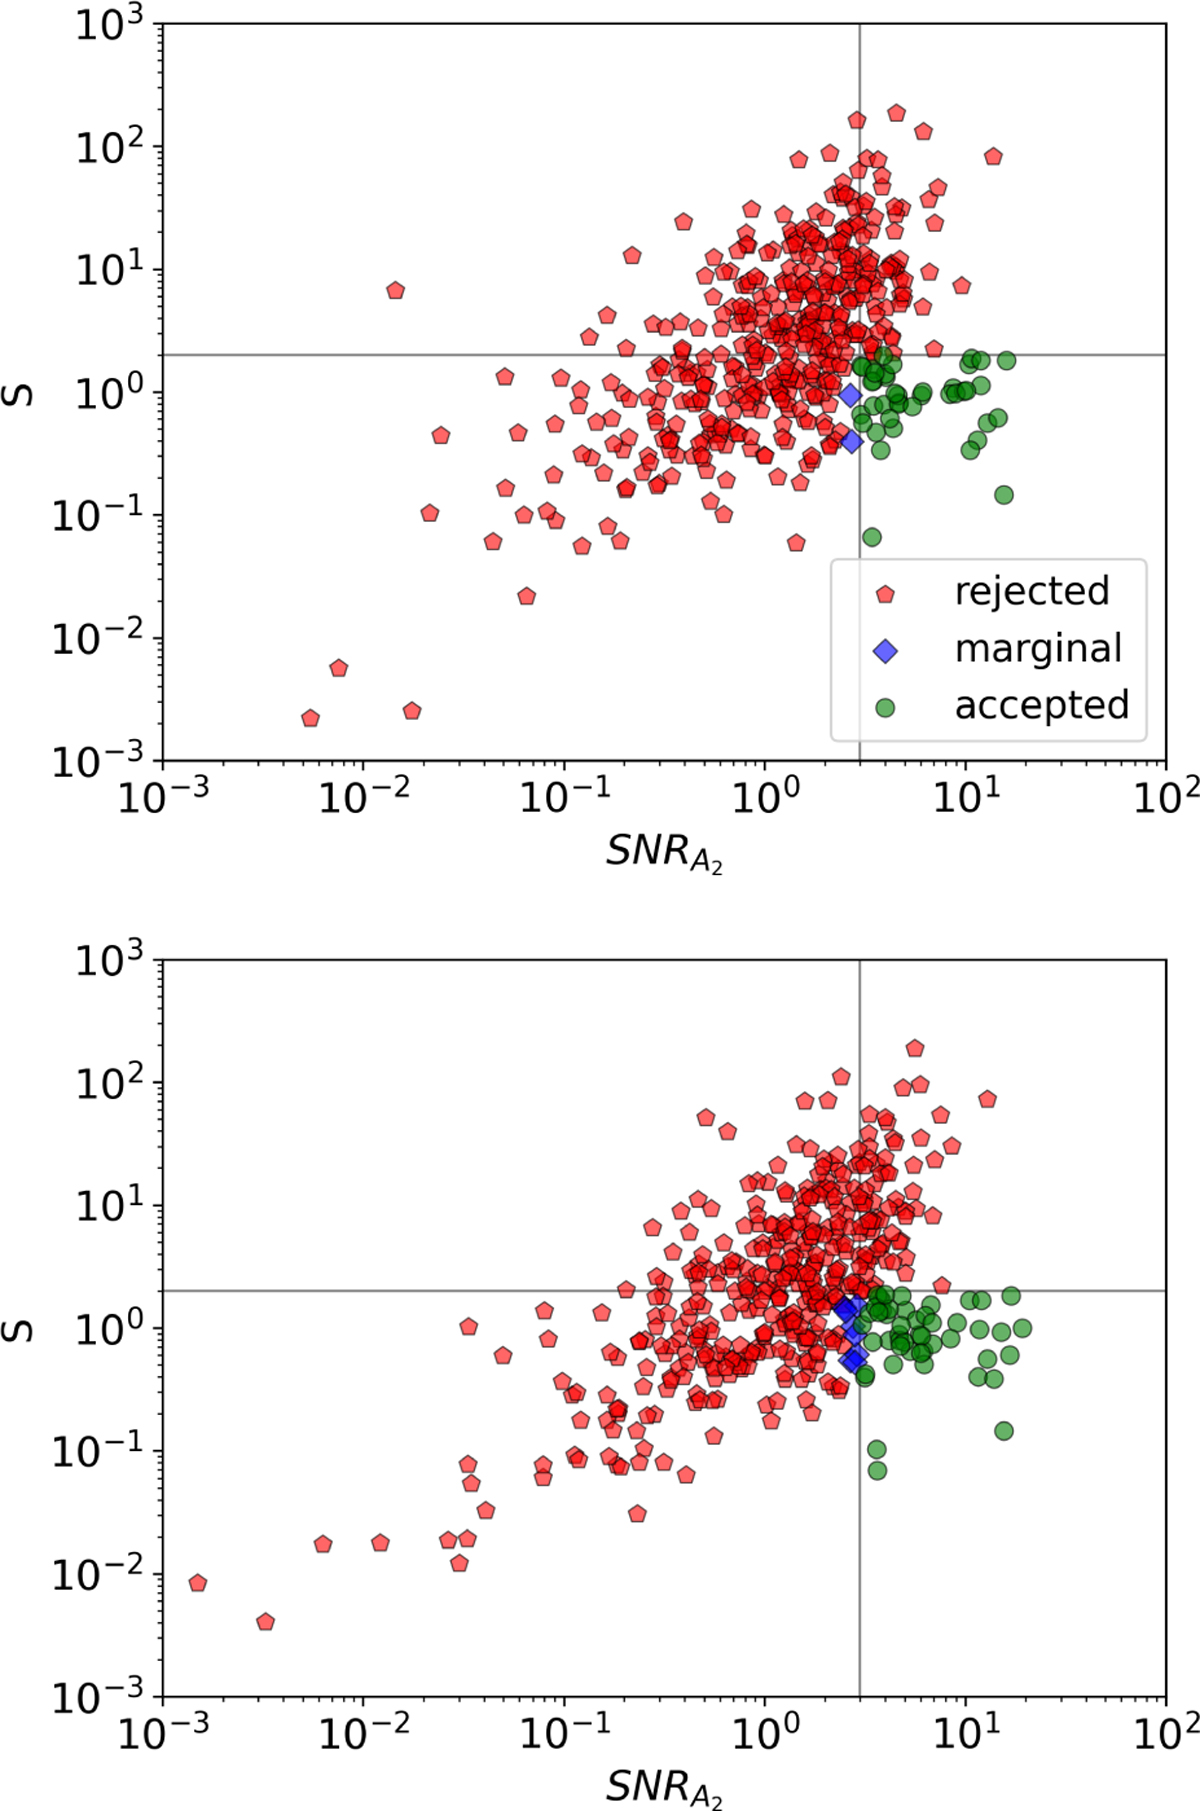
Parameter S as a function of S / NA2 for all NEA without using Gaia DR3 – top panel, using Gaia DR3 – bottom panel. Green circles represent accepted values (S / NA2 > 3 and S < 2) – consistent with the expected value scaled to the (99942) Apophis A2 value, blue circles are marginal cases with 2.5 < S / NA2 < 3 and S < 2 and red are values with S / NA2 > 3 or S > 2.5. The horizontal line represents S =2. The vertical line represents S / NA2 = 3.
Current usage metrics show cumulative count of Article Views (full-text article views including HTML views, PDF and ePub downloads, according to the available data) and Abstracts Views on Vision4Press platform.
Data correspond to usage on the plateform after 2015. The current usage metrics is available 48-96 hours after online publication and is updated daily on week days.
Initial download of the metrics may take a while.