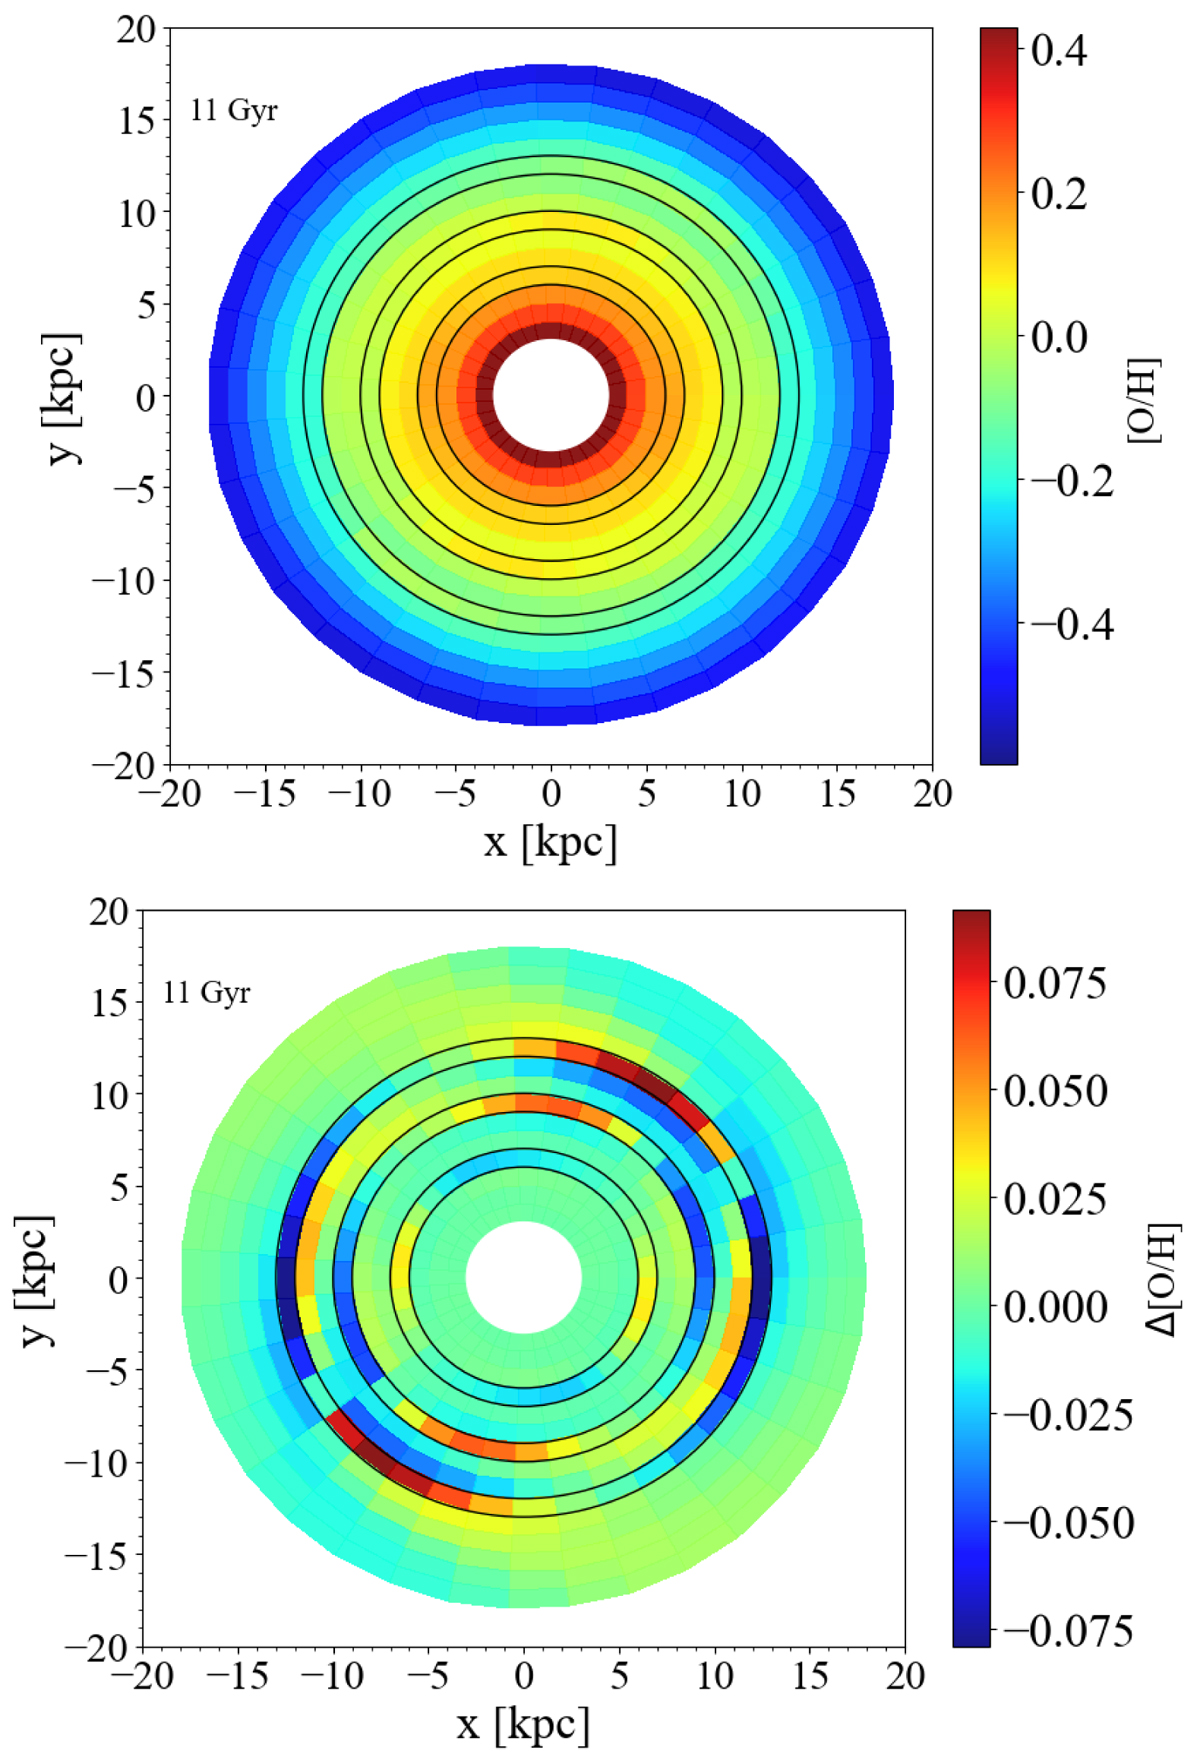
Fig. 9.
Download original image
Oxygen abundance distribution in the Galactic disc resulting from Model A after 11 Gyr of evolution and projected onto the Galactic plane after the start of disc formation (see Table 1 and text for model details). Upper panel: [O/H] values. Lower panel: distribution of residual azimuthal variations Δ [O/H] in oxygen. In each panel, we also highlight the annular regions where the three co-rotational radii are situated using black edges.
Current usage metrics show cumulative count of Article Views (full-text article views including HTML views, PDF and ePub downloads, according to the available data) and Abstracts Views on Vision4Press platform.
Data correspond to usage on the plateform after 2015. The current usage metrics is available 48-96 hours after online publication and is updated daily on week days.
Initial download of the metrics may take a while.