Open Access
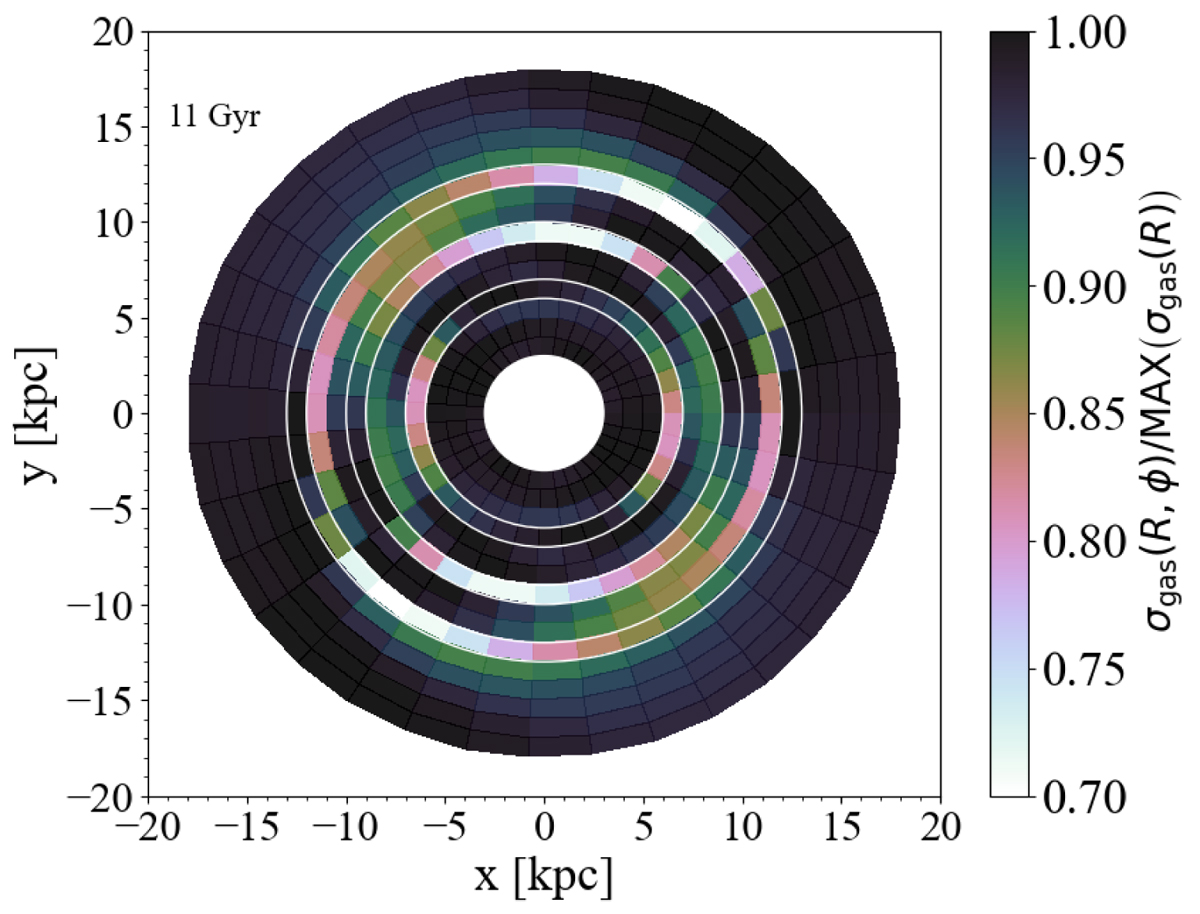
Fig. 8.
Download original image
Galactic disc surface gas density distribution resulting from Model A after 11 Gyr of evolution normalised to the maximum values at different galactocentric distances. We also use white edges to highlight the annular regions where three co-rotational radii are situated.
Current usage metrics show cumulative count of Article Views (full-text article views including HTML views, PDF and ePub downloads, according to the available data) and Abstracts Views on Vision4Press platform.
Data correspond to usage on the plateform after 2015. The current usage metrics is available 48-96 hours after online publication and is updated daily on week days.
Initial download of the metrics may take a while.