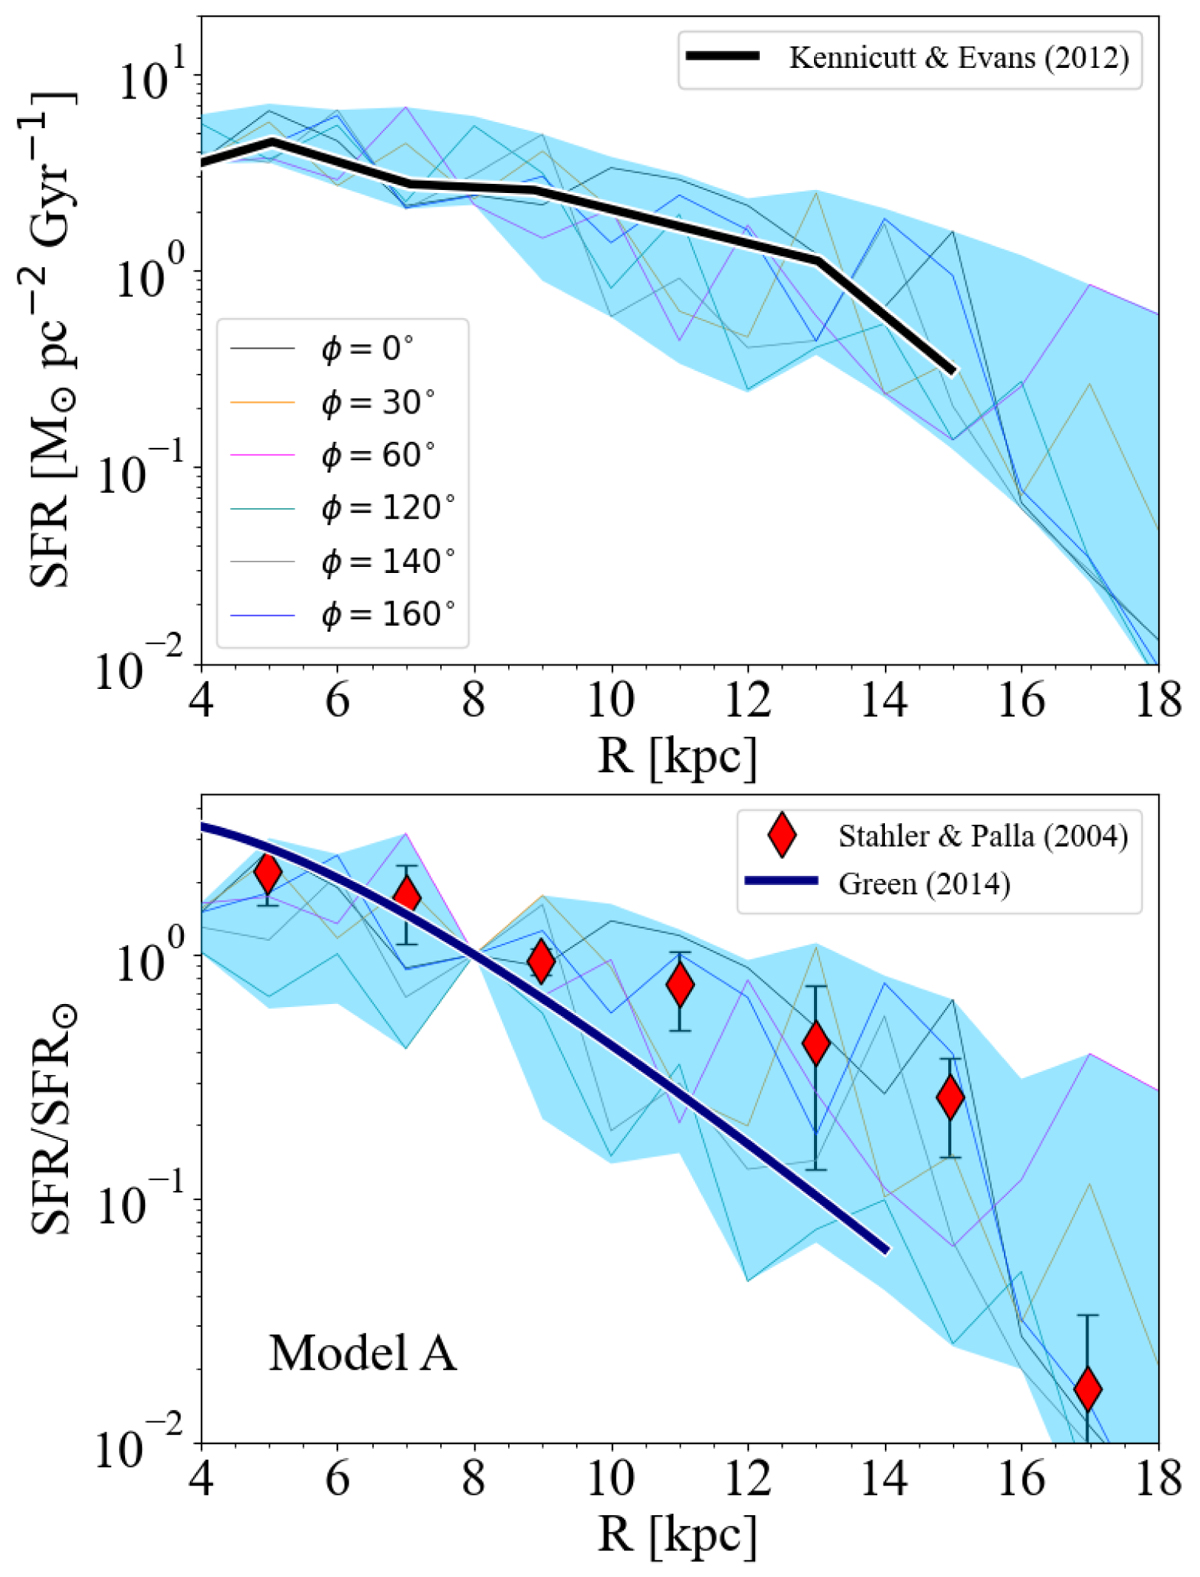
Fig. 5.
Download original image
Present-day radial SFR profile predicted by Model A for different azimuthal coordinates (coloured lines). In both panels, the shaded light-blue area denotes the range of maximum and minimum SFR values at various galactocentric distances. Upper panel: predicted SFRs are compared with the visible-band observations presented in Guesten & Mezger (1982) and rescaled by Kennicutt & Evans (2012) to the total SFR of 1.9 M⊙ yr−1 provided by Chomiuk & Povich (2011), as indicated by the black solid line. Lower panel: red diamonds with error bars are observational data for the star formation profile from SNRs, pulsars, and HII regions normalised to the solar vicinity value (SFR/SFR⊙) from Stahler & Palla (2004). The dark-blue solid line represents the analytical fit of the SNR compilation by Green (2014) as reported in Palla et al. (2020) and Spitoni et al. (2021). The model predictions for different azimuths SFRϕ are divided by their respective solar vicinity SFR⊙, ϕ values.
Current usage metrics show cumulative count of Article Views (full-text article views including HTML views, PDF and ePub downloads, according to the available data) and Abstracts Views on Vision4Press platform.
Data correspond to usage on the plateform after 2015. The current usage metrics is available 48-96 hours after online publication and is updated daily on week days.
Initial download of the metrics may take a while.