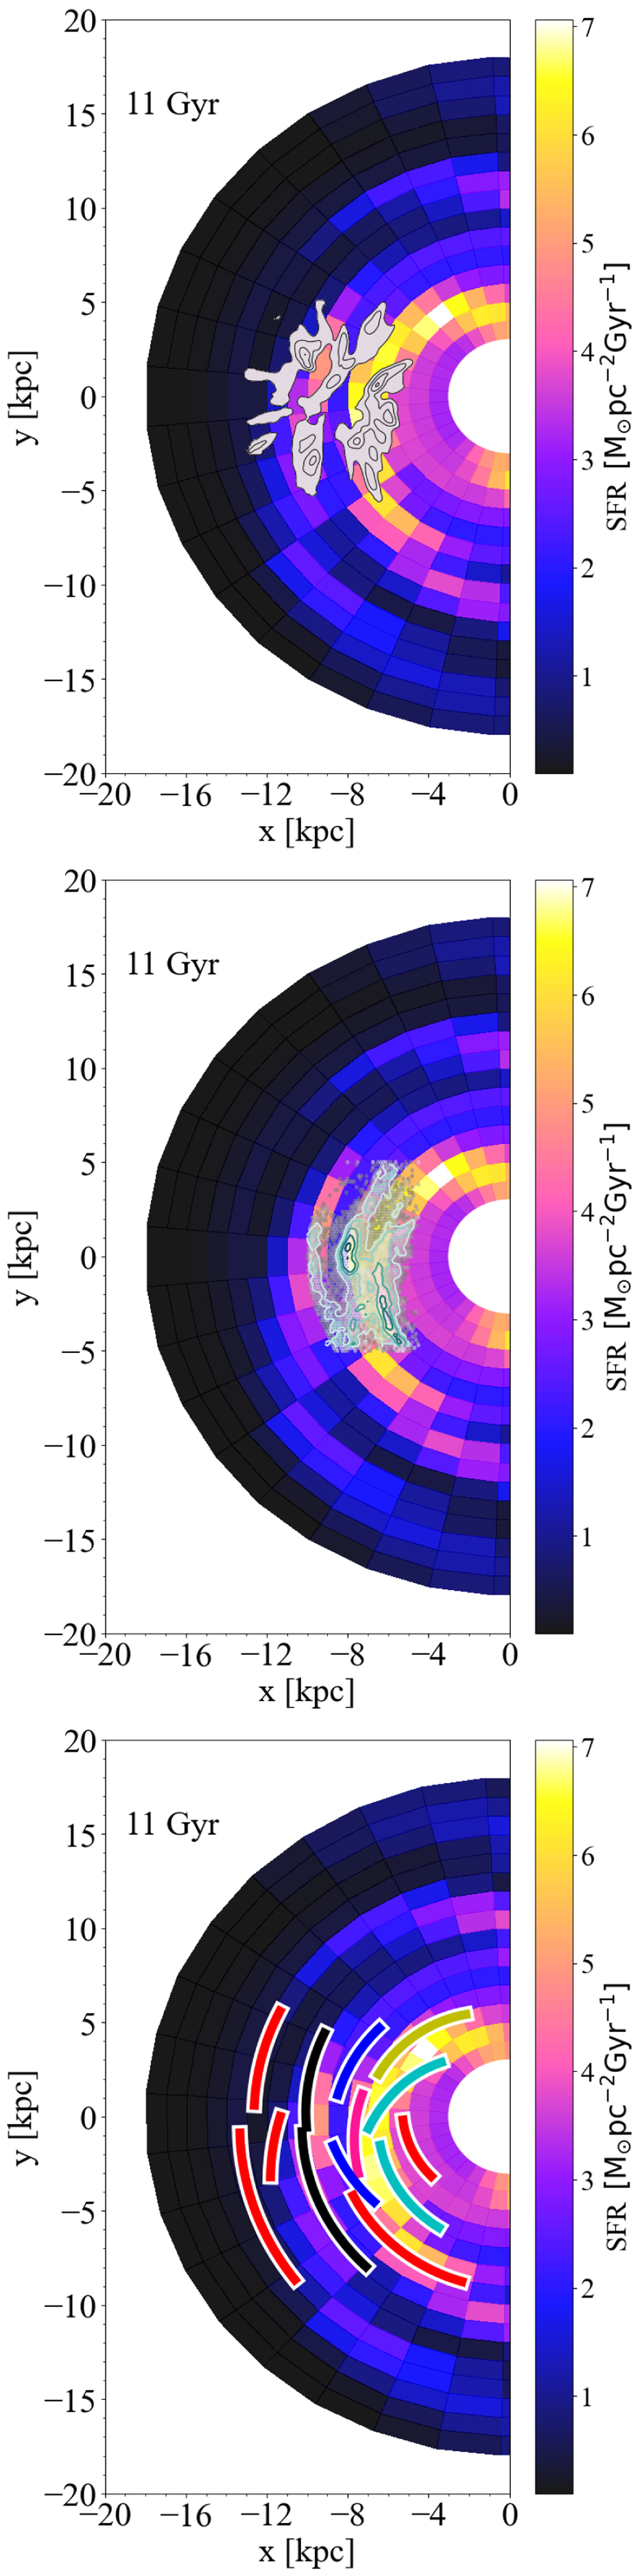
Fig. 4.
Download original image
Zoom-in view of 2D map of the SFR resulting from Model A after 11 Gyr of the evolution of Fig. 3 compared with some tracers of spiral arms or arcs present in literature. Upper panel: overdensities in the distribution of UMS stars of the Poggio et al. (2018) sample with Gaia EDR3 astrometry (Gaia Collaboration 2021a) as presented by Poggio et al. (2021). We report only positive values of stellar overdensities as defined by Eq. (1) of Poggio et al. (2021). Middle panel: distribution of the median of the radial action JR of Gaia DR3 stars (see text for more details) on the Galactic Plane (|Zmax|< 0.5 kpc and R < 10 kpc) as computed by Palicio et al. (2023b) and here only reporting the star with JR < 0.01 R⊙ V⊙ (green shaded area). Lower panel: solid lines represent the segments of spiral arms traced by Cepheids of Lemasle et al. (2022) in which the colour coding is the one adopted by Palicio et al. (2023b).
Current usage metrics show cumulative count of Article Views (full-text article views including HTML views, PDF and ePub downloads, according to the available data) and Abstracts Views on Vision4Press platform.
Data correspond to usage on the plateform after 2015. The current usage metrics is available 48-96 hours after online publication and is updated daily on week days.
Initial download of the metrics may take a while.