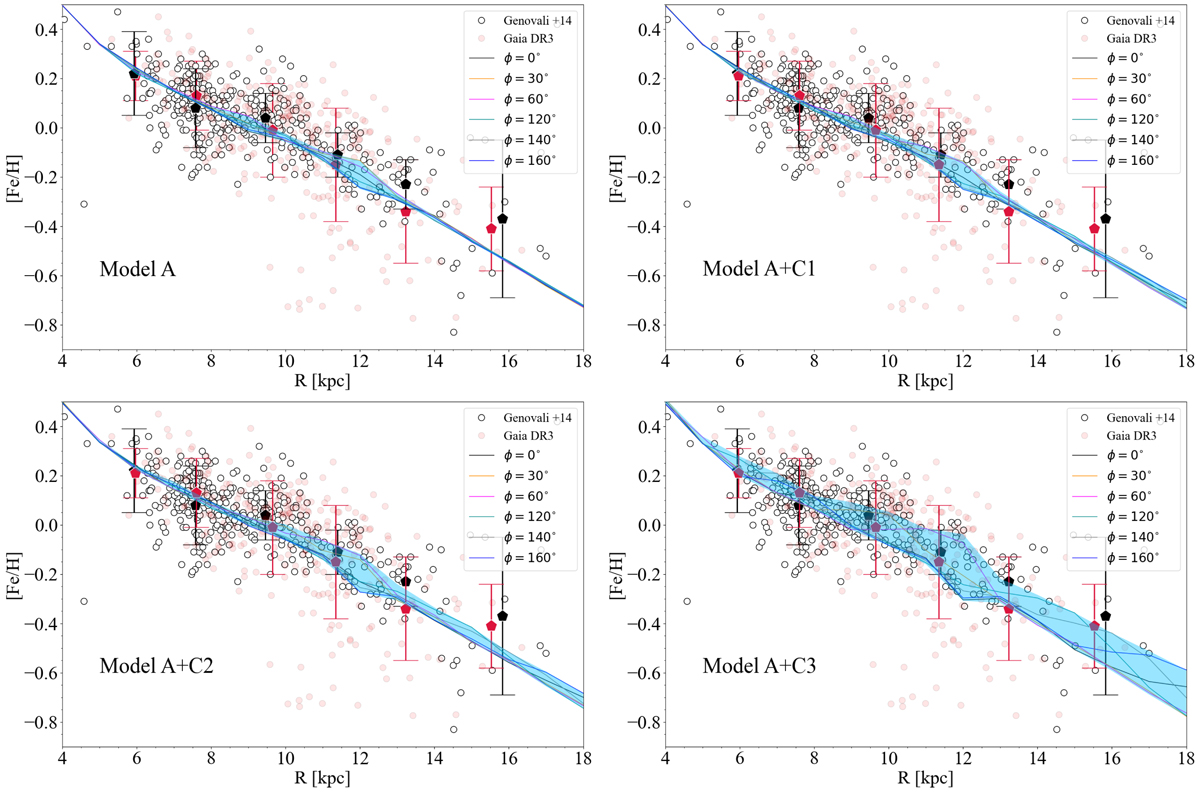
Fig. 17.
Download original image
Present-day iron abundance gradient predicted by Models A, A+C1, A+C2, and A+C3 at different azimuthal coordinates. In each panel, the shaded light-blue area denotes the range of maximum and minimum Fe abundance values at various distances from the centre of the galaxy spanned by the models. The Cepheids data collected by Genovali et al. (2014) and the GSP-Spec [M/H] for Gaia DR3 sources within the sample of Cepheids presented by Ripepi et al. (2023) are reported with empty and full light-red dots, respectively. The average abundance values and relative errors – when dividing these two data sets into six radial bins – are shown by black and red pentagons, respectively.
Current usage metrics show cumulative count of Article Views (full-text article views including HTML views, PDF and ePub downloads, according to the available data) and Abstracts Views on Vision4Press platform.
Data correspond to usage on the plateform after 2015. The current usage metrics is available 48-96 hours after online publication and is updated daily on week days.
Initial download of the metrics may take a while.