Fig. 11.
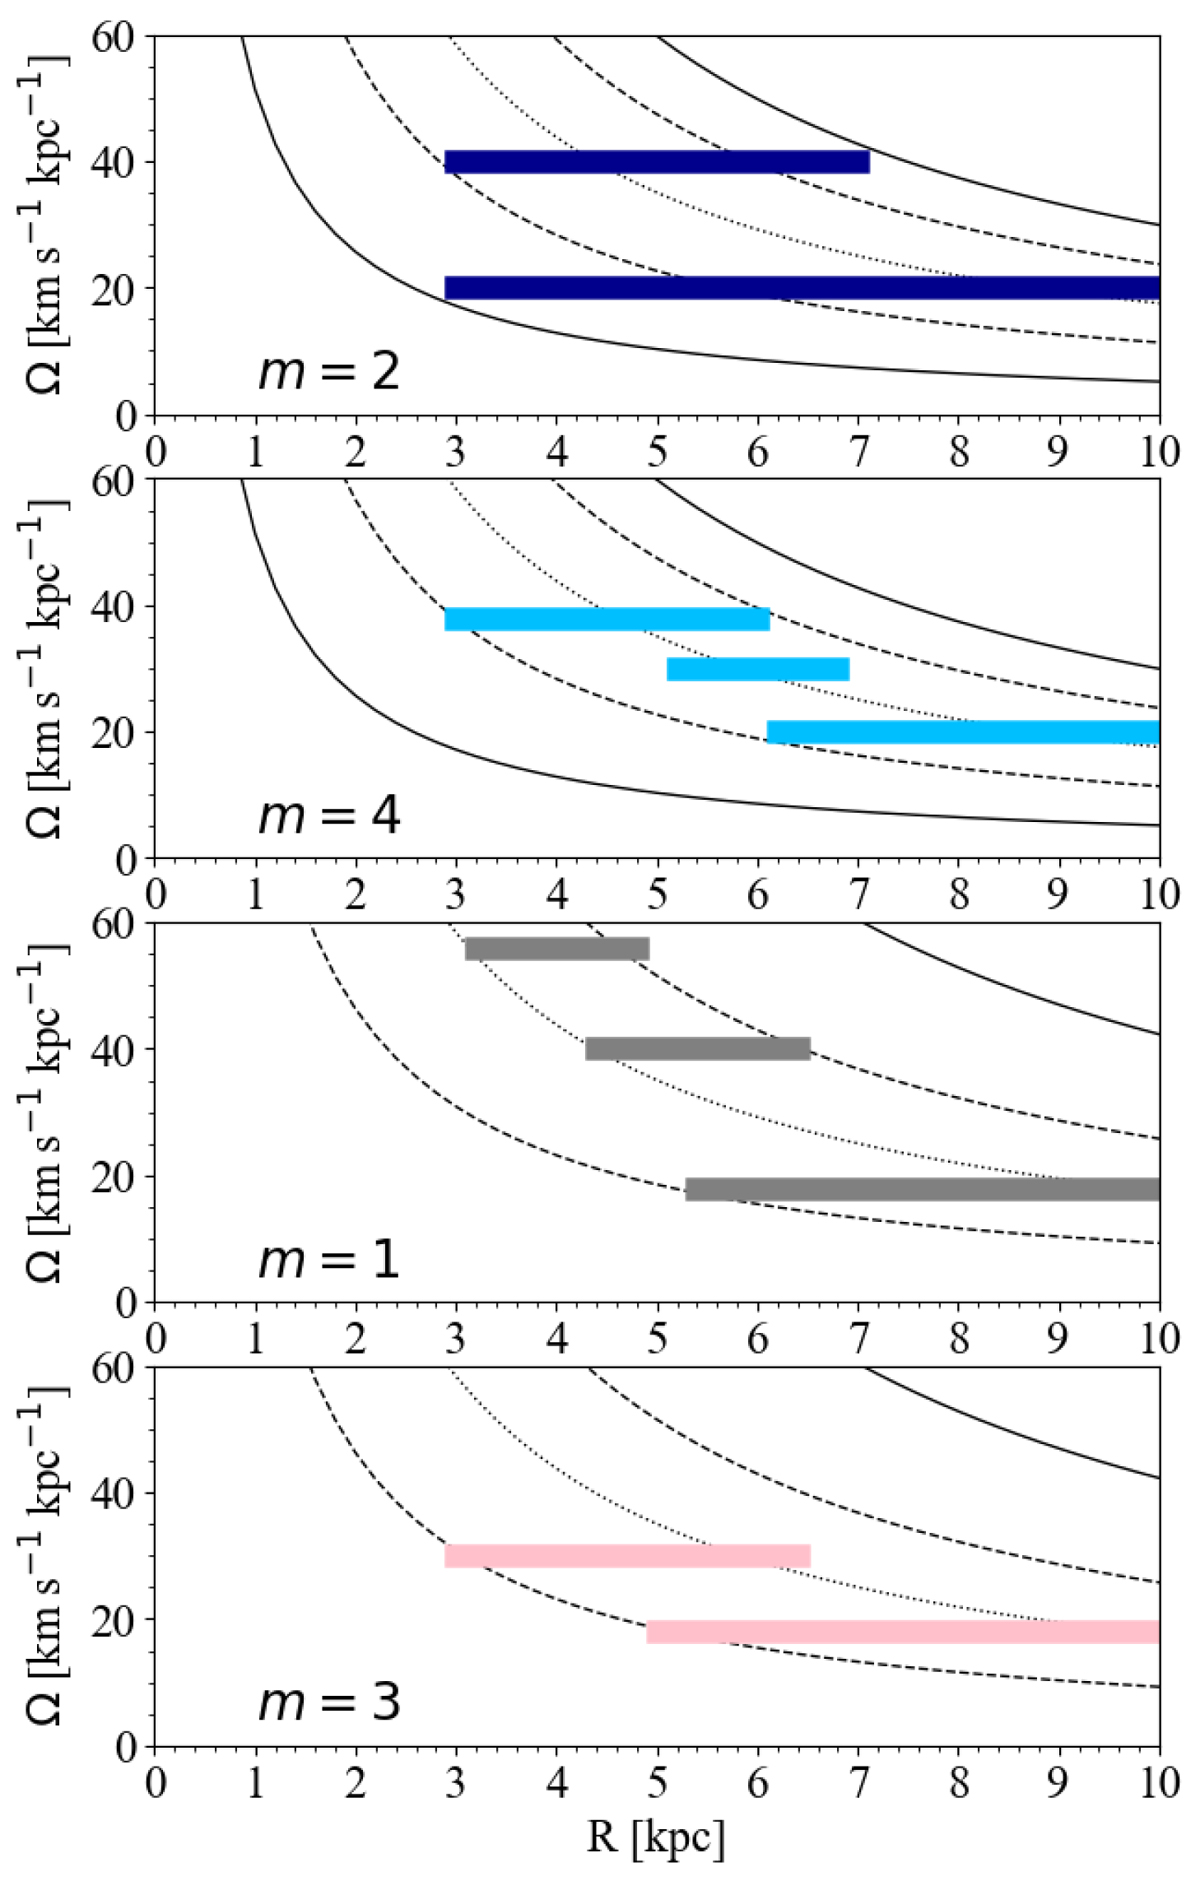
Download original image
As in Fig. 1, but for spiral modes extracted from the spectrogram analysis of Model1 by Hilmi et al. (2020), which was based on the Buck et al. (2020) cosmological simulation. Different multiplicities are shown in each panel, as indicated. In each panel, the disc angular velocity Ωd(R) is indicated with the dotted line. In the two upper panels (with modes m = 2 and m = 4), we also show the resonances Ωp2(R) = Ωd(R)±κ/2 and Ωp4(R) = Ωd(R)±κ/4, which are indicated with solid and dashed black curves, respectively. In the lower two panels, the solid and dashed black lines were computed as Ωp1(R) = Ωd(R)±κ and Ωp3(R) = Ωd(R)±κ/3.
Current usage metrics show cumulative count of Article Views (full-text article views including HTML views, PDF and ePub downloads, according to the available data) and Abstracts Views on Vision4Press platform.
Data correspond to usage on the plateform after 2015. The current usage metrics is available 48-96 hours after online publication and is updated daily on week days.
Initial download of the metrics may take a while.