Fig. 6
Download original image
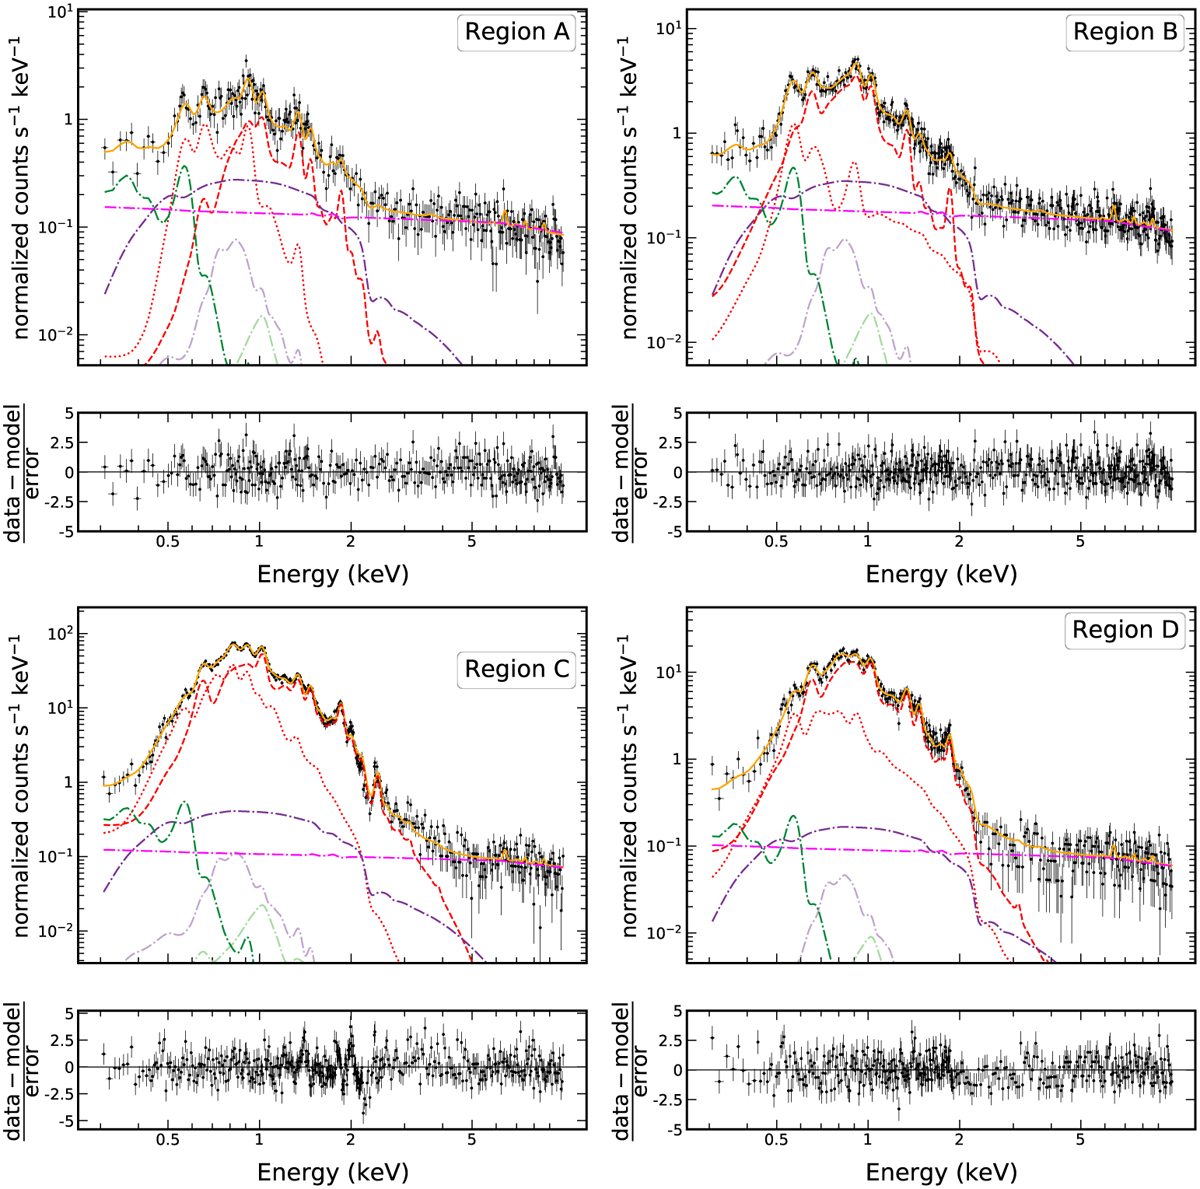
Spectra from regions A, B, C, and D. The solid yellow line indicates the total model, the red dotted line represents the first additive component (VPSHOCK), and the red dashed line the second additive component (VPSHOCK). The dash dot lines show the different background components: the horizontal magenta line is the most significant component of the particle background, the others represent the sky background made by the Local Hot Bubble (dark green), cosmic X-ray background (violet), Cosmic Halo 1 (light violet), and Cosmic Halo 2 (light green). The spectra have been rebinned for better visualization and the parameters of the model are the median values of the last 2000 steps of the emcee run.
Current usage metrics show cumulative count of Article Views (full-text article views including HTML views, PDF and ePub downloads, according to the available data) and Abstracts Views on Vision4Press platform.
Data correspond to usage on the plateform after 2015. The current usage metrics is available 48-96 hours after online publication and is updated daily on week days.
Initial download of the metrics may take a while.