Fig. 1
Download original image
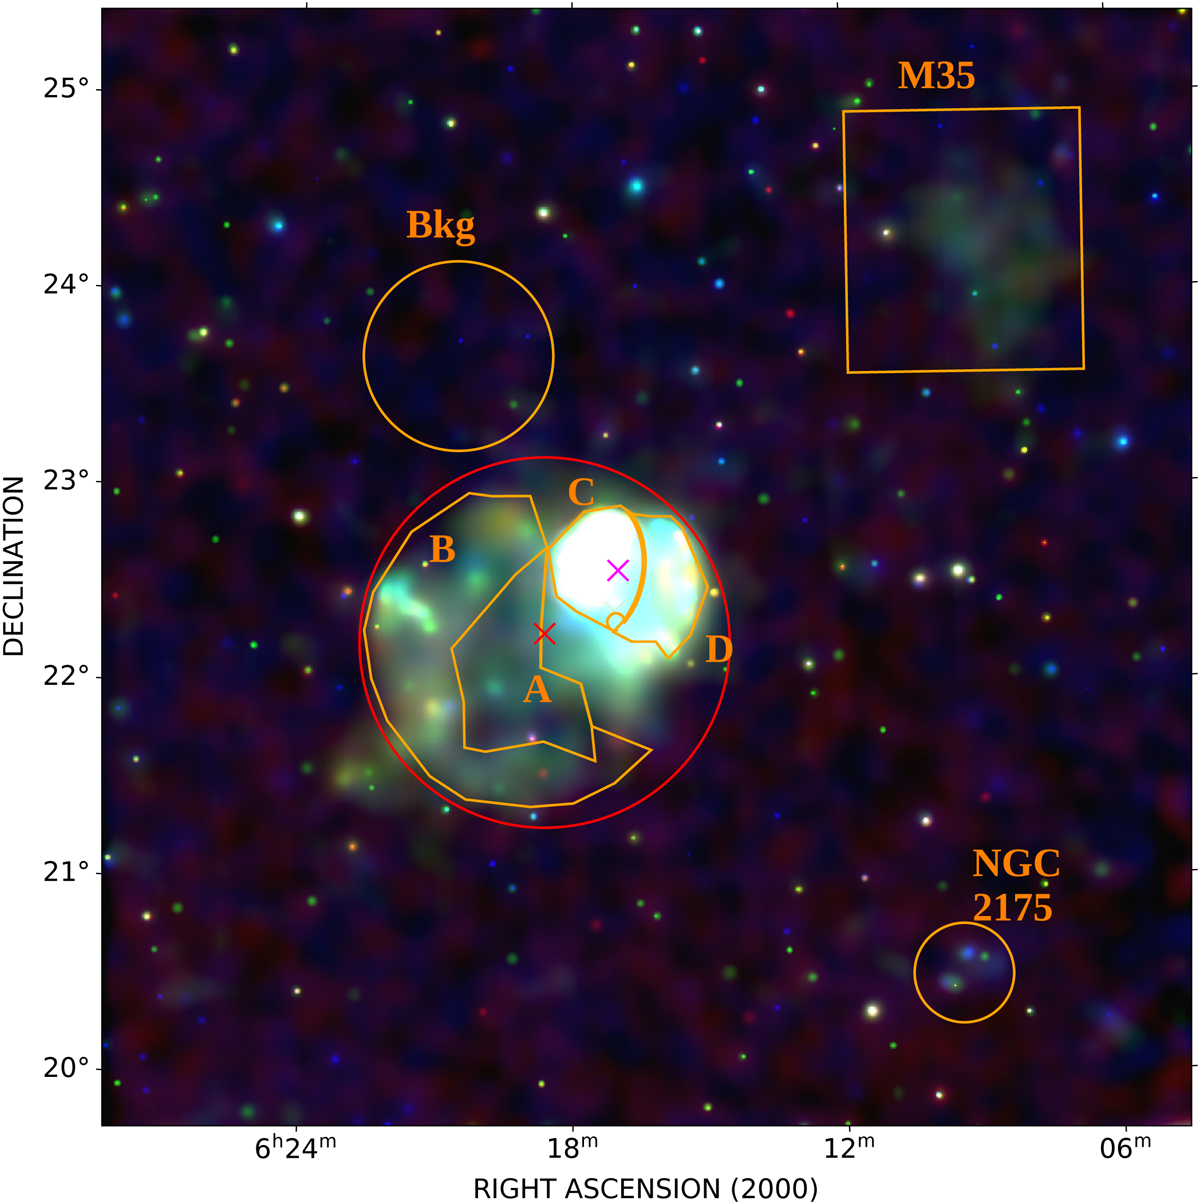
False color image (red: 0.2-0.7 keV, green: 0.7–1.1 keV, blue: 1.1–10 keV) of the SNR IC443 and SNR G189.6+03.3 obtained with eRASS:4 dataset. For each of the three images, we applied the adaptive smoothing algorithm of Ebeling et al. (2006) with a minimum significance of the signal of S /N = 3 and a maximum of S /N = 5. The minimum scale of smoothing is 1 pixel, while the maximum is 8 pixels. The scale of the colors has been particularly stretched to highlight the diffuse emission. In orange, we display the extraction regions employed for the spectral analysis. The red circle is not used for spectral analysis purposes and is simply indicative of the suggested extension of G189.6+03.3 (the red cross marks the center of the circle at RA:06h19m40.8s, Dec:+21:58:03). The magenta cross indicates the center of IC443 at RA:06h17m0s and Dec:+22:34:00.
Current usage metrics show cumulative count of Article Views (full-text article views including HTML views, PDF and ePub downloads, according to the available data) and Abstracts Views on Vision4Press platform.
Data correspond to usage on the plateform after 2015. The current usage metrics is available 48-96 hours after online publication and is updated daily on week days.
Initial download of the metrics may take a while.