Open Access
Fig. 6
Download original image
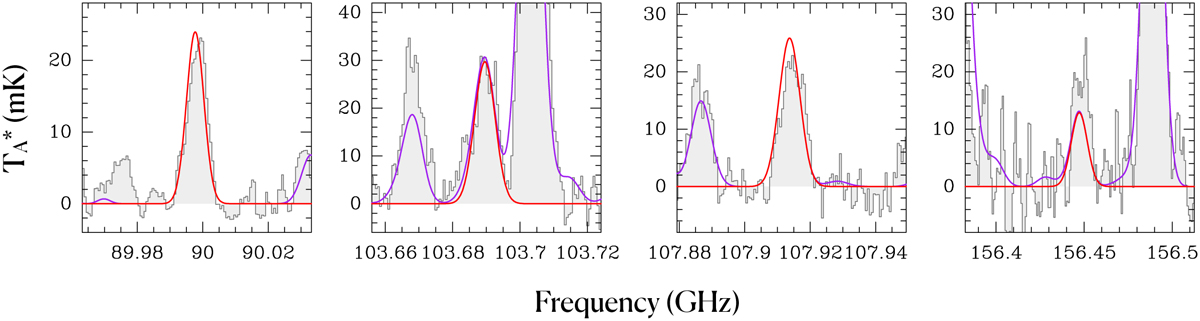
Selected clean transitions of propene (CH2=CHCH3) detected towards the G+0.693 molecular cloud. The black line and grey histogram show the observed spectrum. The LTE fit of propene is indicated with a red curve, while the emission from all the molecules identified in G+0.693 are indicated in purple.
Current usage metrics show cumulative count of Article Views (full-text article views including HTML views, PDF and ePub downloads, according to the available data) and Abstracts Views on Vision4Press platform.
Data correspond to usage on the plateform after 2015. The current usage metrics is available 48-96 hours after online publication and is updated daily on week days.
Initial download of the metrics may take a while.