Fig. 7
Download original image
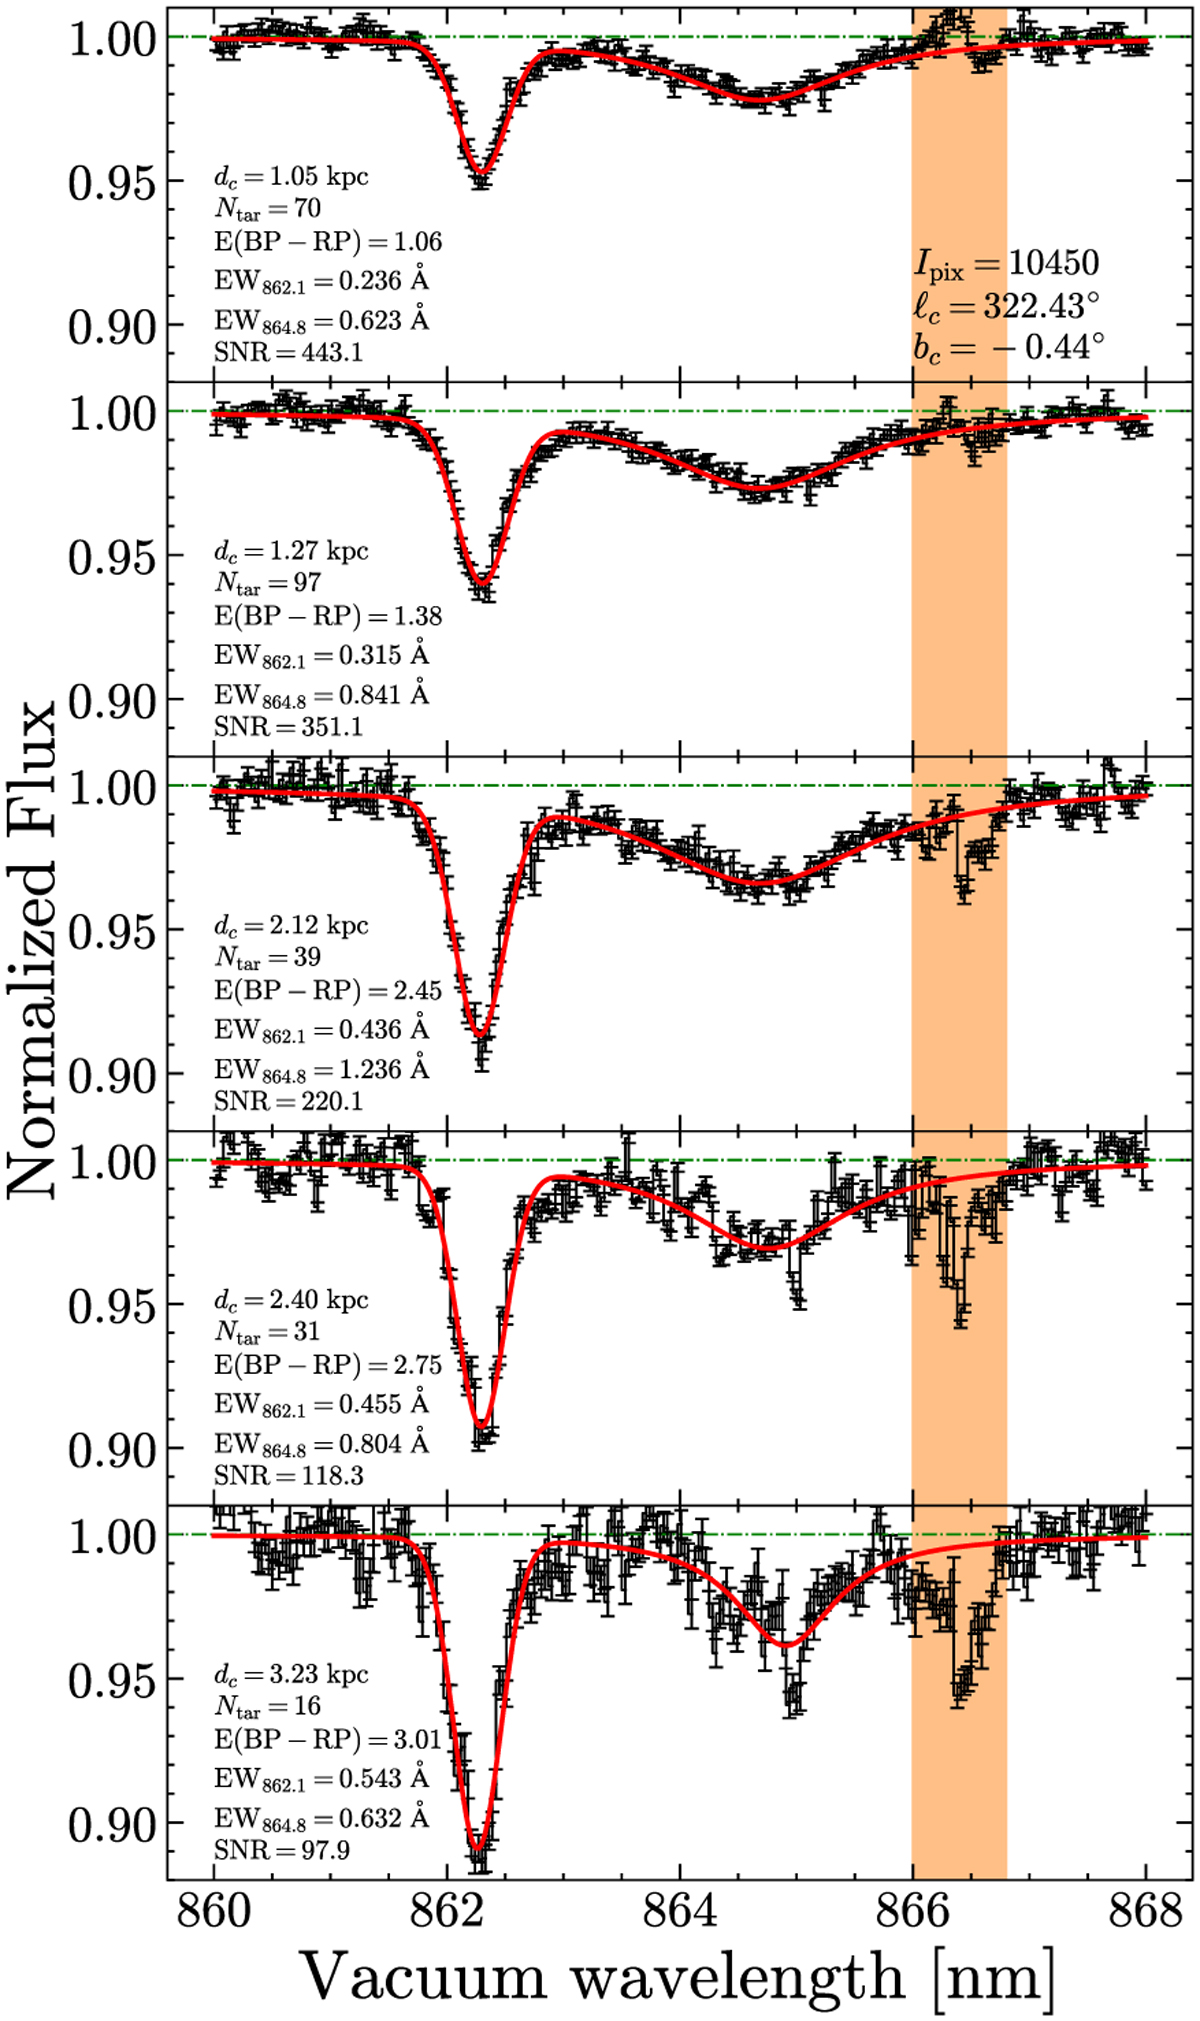
Examples of the fits to DIBs λ862.1 and λ864.8 in stacked ISM spectra in five voxels in the same direction, whose HEALPix number (Ipix = 10 450) and GC (ℓc, bc) = (322.43°, −0.44°) are marked in the top panel. The black and red lines are the ISM spectra and fitted DIB profiles, respectively, normalized by the fitted linear continuum. The error bars indicate the flux uncertainties at each pixel. Orange indicates the region that was masked during the fittings. The central heliocentric distance (dc), the number of target spectra (Ntar), mean E(BP − RP), EWs of two DIBs, and the S/N of the stacked ISM spectrum in each voxel are indicated as well.
Current usage metrics show cumulative count of Article Views (full-text article views including HTML views, PDF and ePub downloads, according to the available data) and Abstracts Views on Vision4Press platform.
Data correspond to usage on the plateform after 2015. The current usage metrics is available 48-96 hours after online publication and is updated daily on week days.
Initial download of the metrics may take a while.