Fig. 6
Download original image
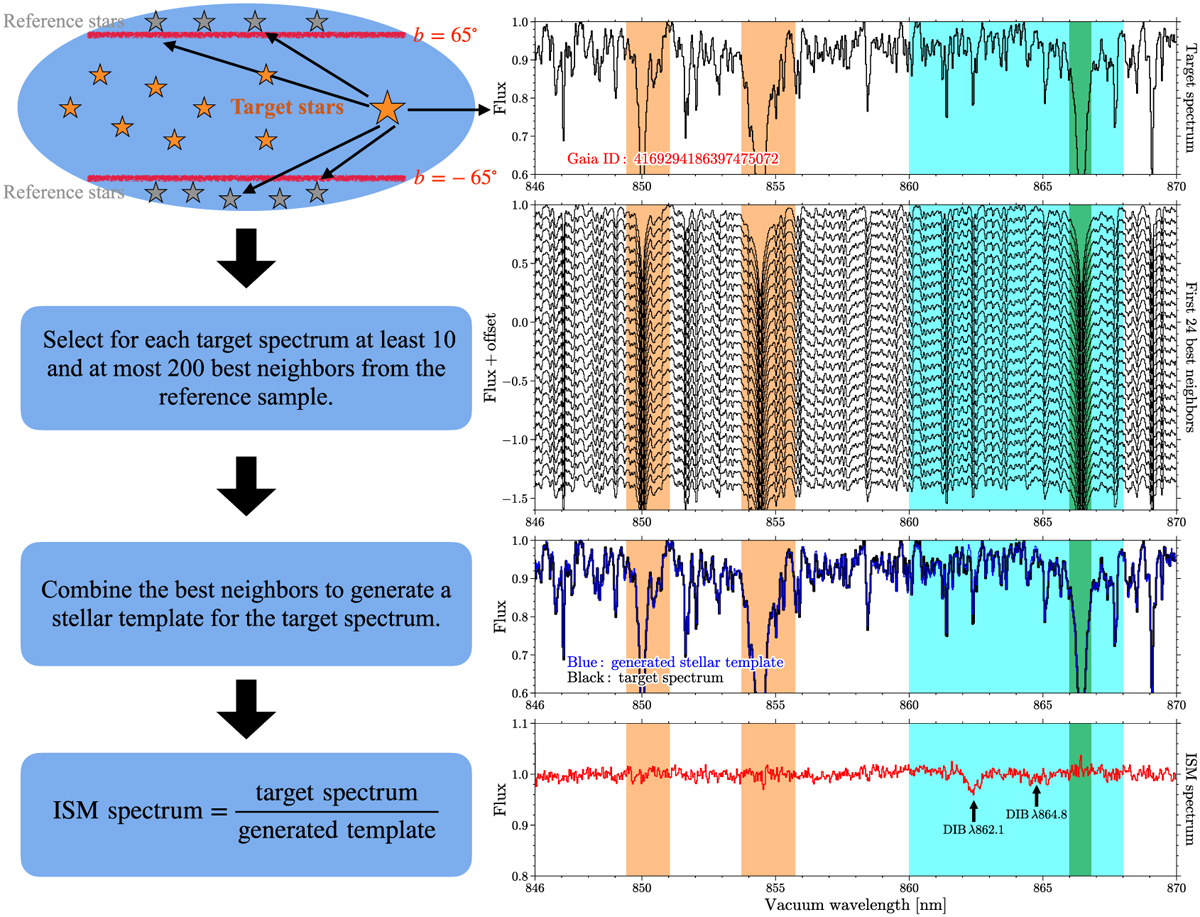
Illustration of deriving ISM spectra for individual targets. Left: Schematic view of each main step. Detailed explanations are in Sect. 3.2. Right: Example for a target (Gaia ID: 4169294186397475072) having ![]() K, log ɡ = 1.86 ± 0.03 dex,
K, log ɡ = 1.86 ± 0.03 dex, ![]() dex, and spectral S/N of 110.3. From top to bottom panels: 1) Observed RVS spectrum of this target; 2) First 24 best neighbours for this target; 3) The black line is the target spectrum and the blue line is its stellar template built by averaging 200 best neighbours; 4) Derived ISM spectrum for this target. The positions of the two DIBs are also indicated. The orange shades indicate the regions of two Ca II lines where the weights are set to 0.7 when comparing the target spectrum and reference spectra. The cyan region (860–868 nm) indicates the spectral window used for fitting the two DIBs, with a masked region (green, 866.0–866.8 nm) during the fitting because of the residuals of the Ca II line.
dex, and spectral S/N of 110.3. From top to bottom panels: 1) Observed RVS spectrum of this target; 2) First 24 best neighbours for this target; 3) The black line is the target spectrum and the blue line is its stellar template built by averaging 200 best neighbours; 4) Derived ISM spectrum for this target. The positions of the two DIBs are also indicated. The orange shades indicate the regions of two Ca II lines where the weights are set to 0.7 when comparing the target spectrum and reference spectra. The cyan region (860–868 nm) indicates the spectral window used for fitting the two DIBs, with a masked region (green, 866.0–866.8 nm) during the fitting because of the residuals of the Ca II line.
Current usage metrics show cumulative count of Article Views (full-text article views including HTML views, PDF and ePub downloads, according to the available data) and Abstracts Views on Vision4Press platform.
Data correspond to usage on the plateform after 2015. The current usage metrics is available 48-96 hours after online publication and is updated daily on week days.
Initial download of the metrics may take a while.