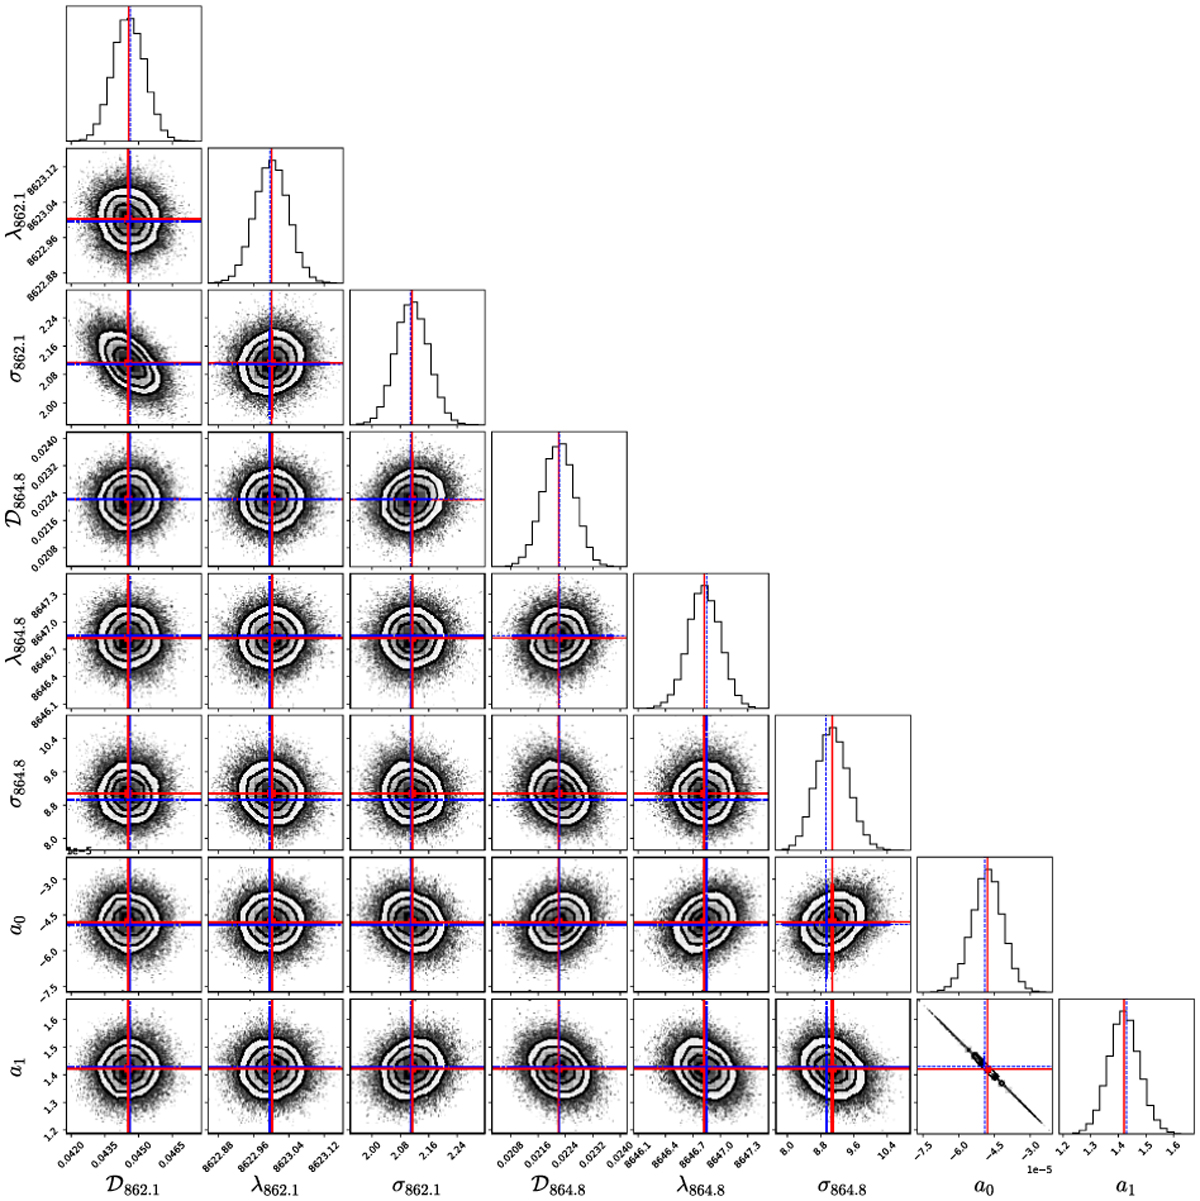
Fig. B.1
Download original image
Corner plot of the DIB fitting in the voxel with Ipix = 10450 and dc = 1.05 kpc (the first panel in Fig. 7 from top to bottom). The histograms and scatter plots show the one- and two-dimensional projections of the posterior distributions of the fitted parameters. The red squares and lines indicate the best-fit estimates for each parameter in the reproduced fitting. And the dashed blue lines mark the fitted parameters in the output table of DIB-Spec.
Current usage metrics show cumulative count of Article Views (full-text article views including HTML views, PDF and ePub downloads, according to the available data) and Abstracts Views on Vision4Press platform.
Data correspond to usage on the plateform after 2015. The current usage metrics is available 48-96 hours after online publication and is updated daily on week days.
Initial download of the metrics may take a while.