Open Access
Fig. A.2
Download original image
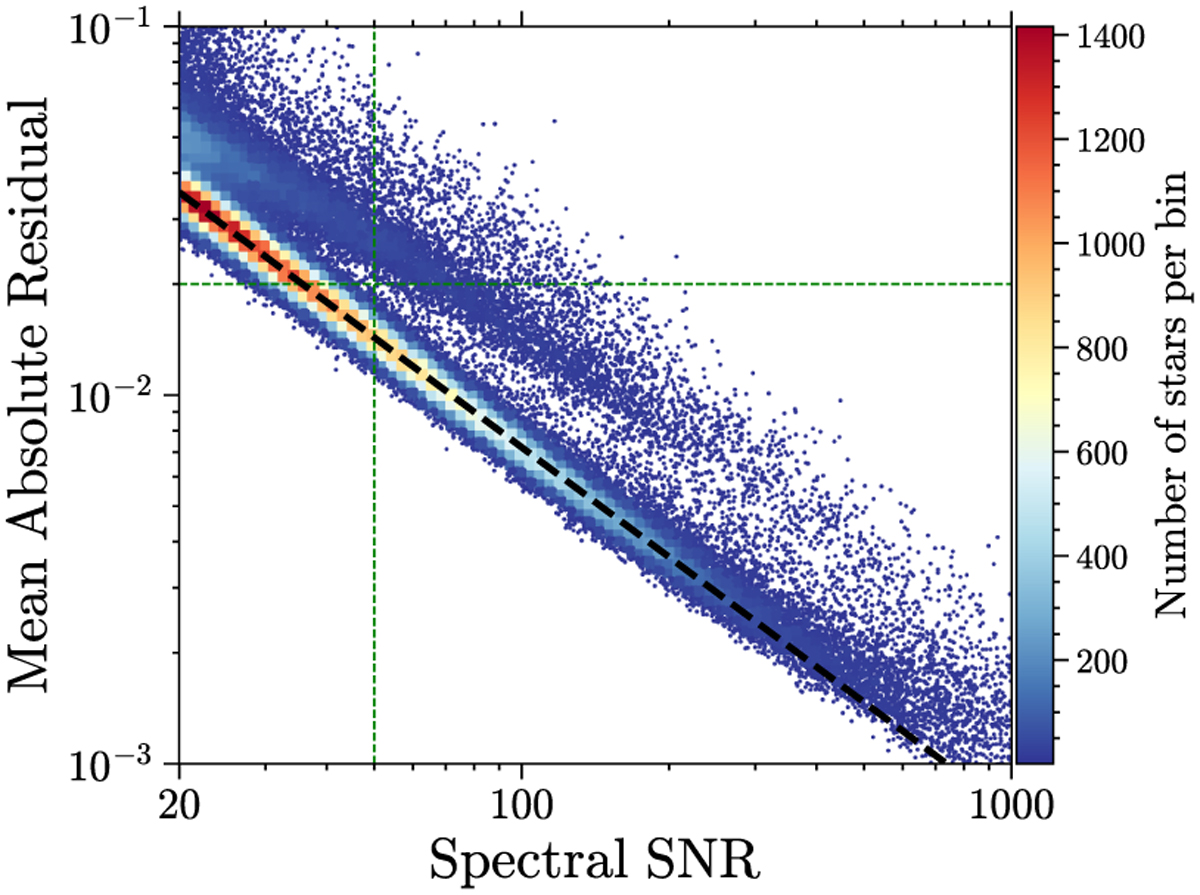
Variation of the mean absolute residual (MAR) between observed and modelled RVS spectra, calculated within the DIB window (861.2−866.0 nm), with the spectral S/N. The dashed green lines indicate S/N = 50 and MAR = 0.02, respectively. The dashed black line is fitted to MAR and S/N on a logarithmic scale.
Current usage metrics show cumulative count of Article Views (full-text article views including HTML views, PDF and ePub downloads, according to the available data) and Abstracts Views on Vision4Press platform.
Data correspond to usage on the plateform after 2015. The current usage metrics is available 48-96 hours after online publication and is updated daily on week days.
Initial download of the metrics may take a while.