Fig. A.1
Download original image
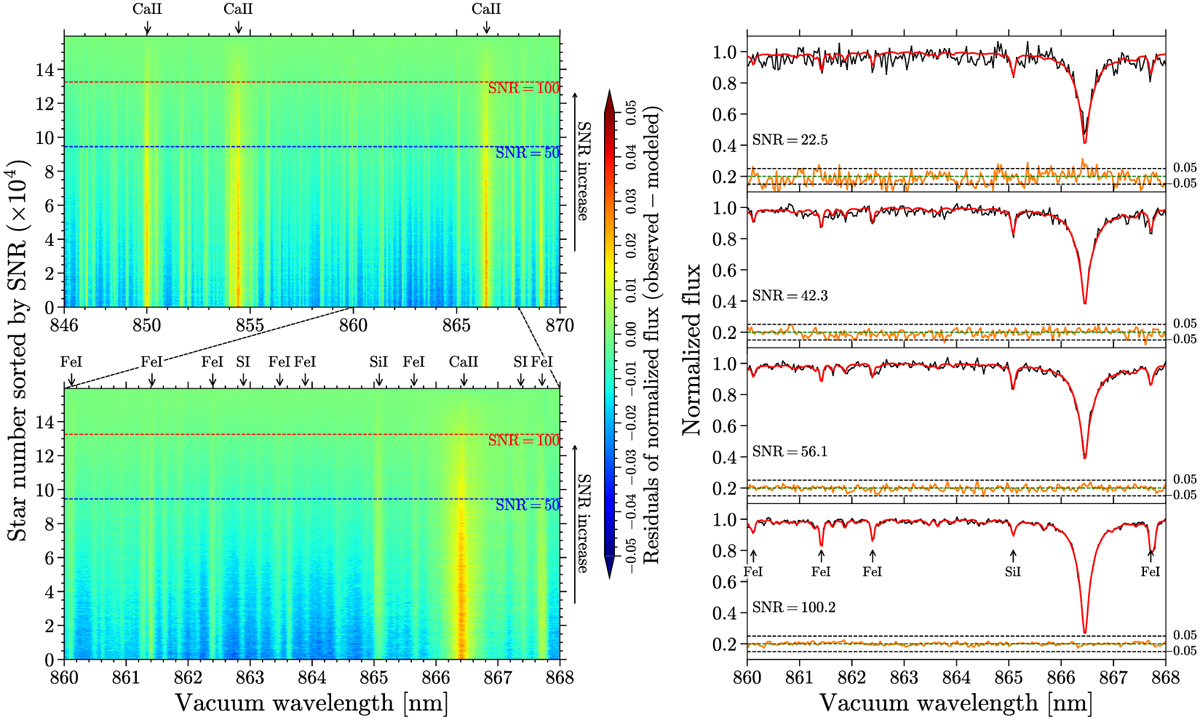
Left panel: Distribution of flux residuals (observed – modelled) with spectral wavelength for 159 591 reference spectra. Each row presents one spectrum and the spectra are sorted by their S/N. The dashed blue and red lines indicate the position of S/N equalling 50 and 100, respectively. Some typical stellar lines within the RVS spectral region determined by Contursi et al. (2021) are indicated as well. The lower panel is a zoom-in plot of the upper one to show the distribution of the residuals in the DIB window (860–868 nm). Right panel: Four examples of the reference spectra (black lines with observed flux errors) and their derived stellar templates (red lines). The orange lines are the flux residuals (observed – modelled) with dashed black lines indicating ±5% of the continuum.
Current usage metrics show cumulative count of Article Views (full-text article views including HTML views, PDF and ePub downloads, according to the available data) and Abstracts Views on Vision4Press platform.
Data correspond to usage on the plateform after 2015. The current usage metrics is available 48-96 hours after online publication and is updated daily on week days.
Initial download of the metrics may take a while.