Fig. 22
Download original image
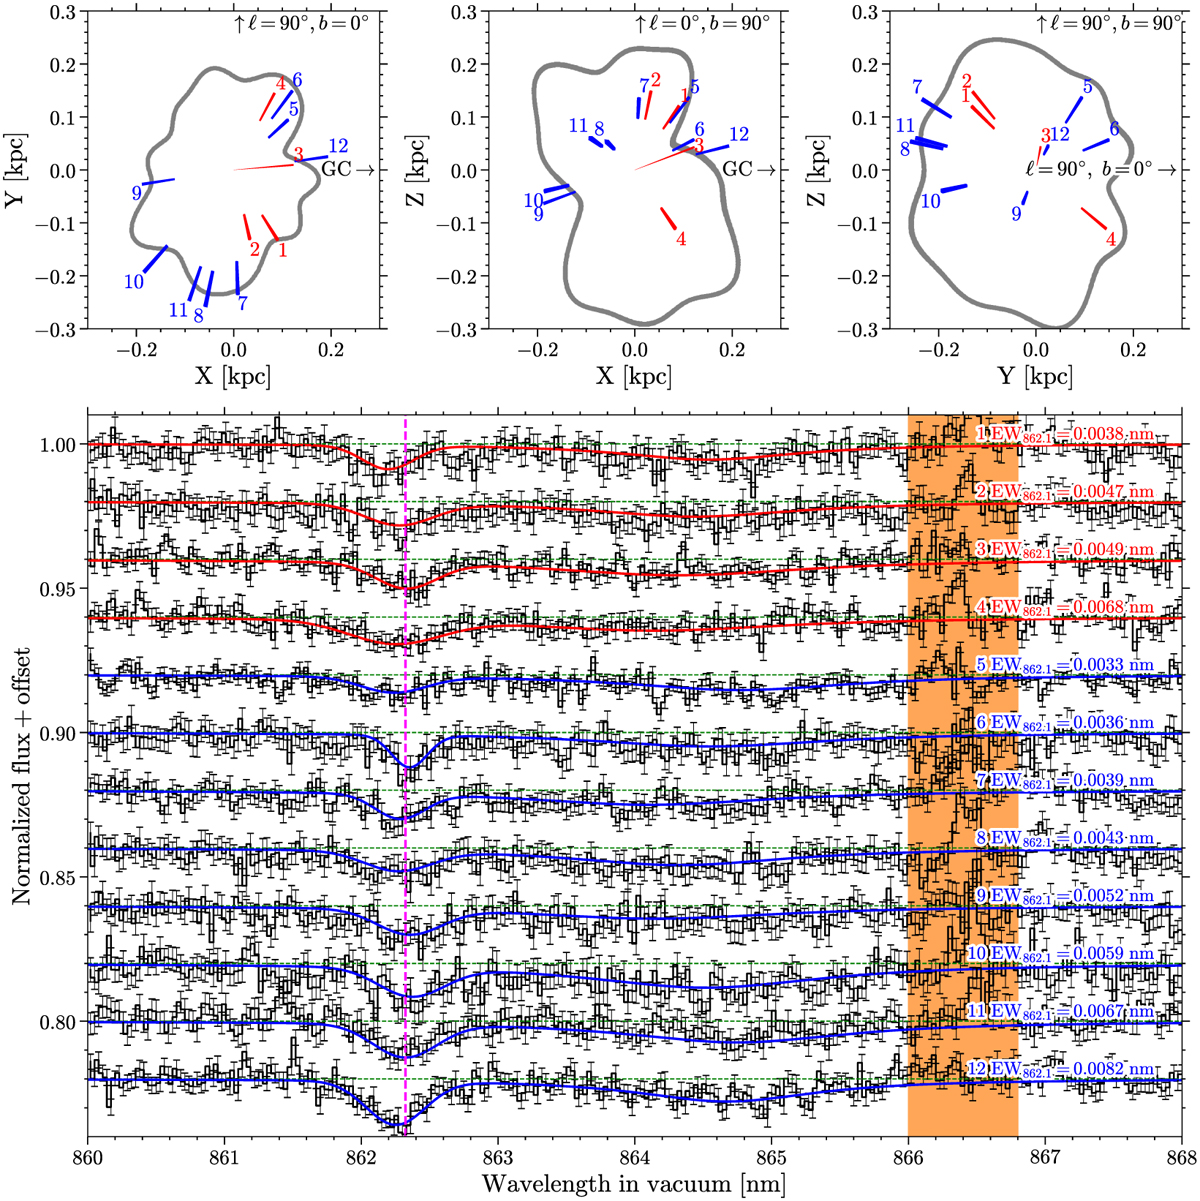
Upper panels: spatial distribution of 12 reliable DIB detections by visual inspection. Their voxels are projected into the Galactic (XY), meridian (XZ), and rotational (YZ) planes. The reds are inside the Local Bubble and the blues are crossed with the surface of the Local Bubble. The grey marks the surface of the Local Bubble determined by Pelgrims et al. (2020). Lower panel: black lines are stacked ISM spectra, and the red/blue lines are the DIB fitting results of the corresponding DIB profiles. The orange indicates the masked spectral region between 866 and 866.8 nm in the fitting. The vertical dashed magenta line indicates the rest-frame wavelength of DIB λ862.1 of 862.323 nm determined in Gaia Collaboration (2023).
Current usage metrics show cumulative count of Article Views (full-text article views including HTML views, PDF and ePub downloads, according to the available data) and Abstracts Views on Vision4Press platform.
Data correspond to usage on the plateform after 2015. The current usage metrics is available 48-96 hours after online publication and is updated daily on week days.
Initial download of the metrics may take a while.