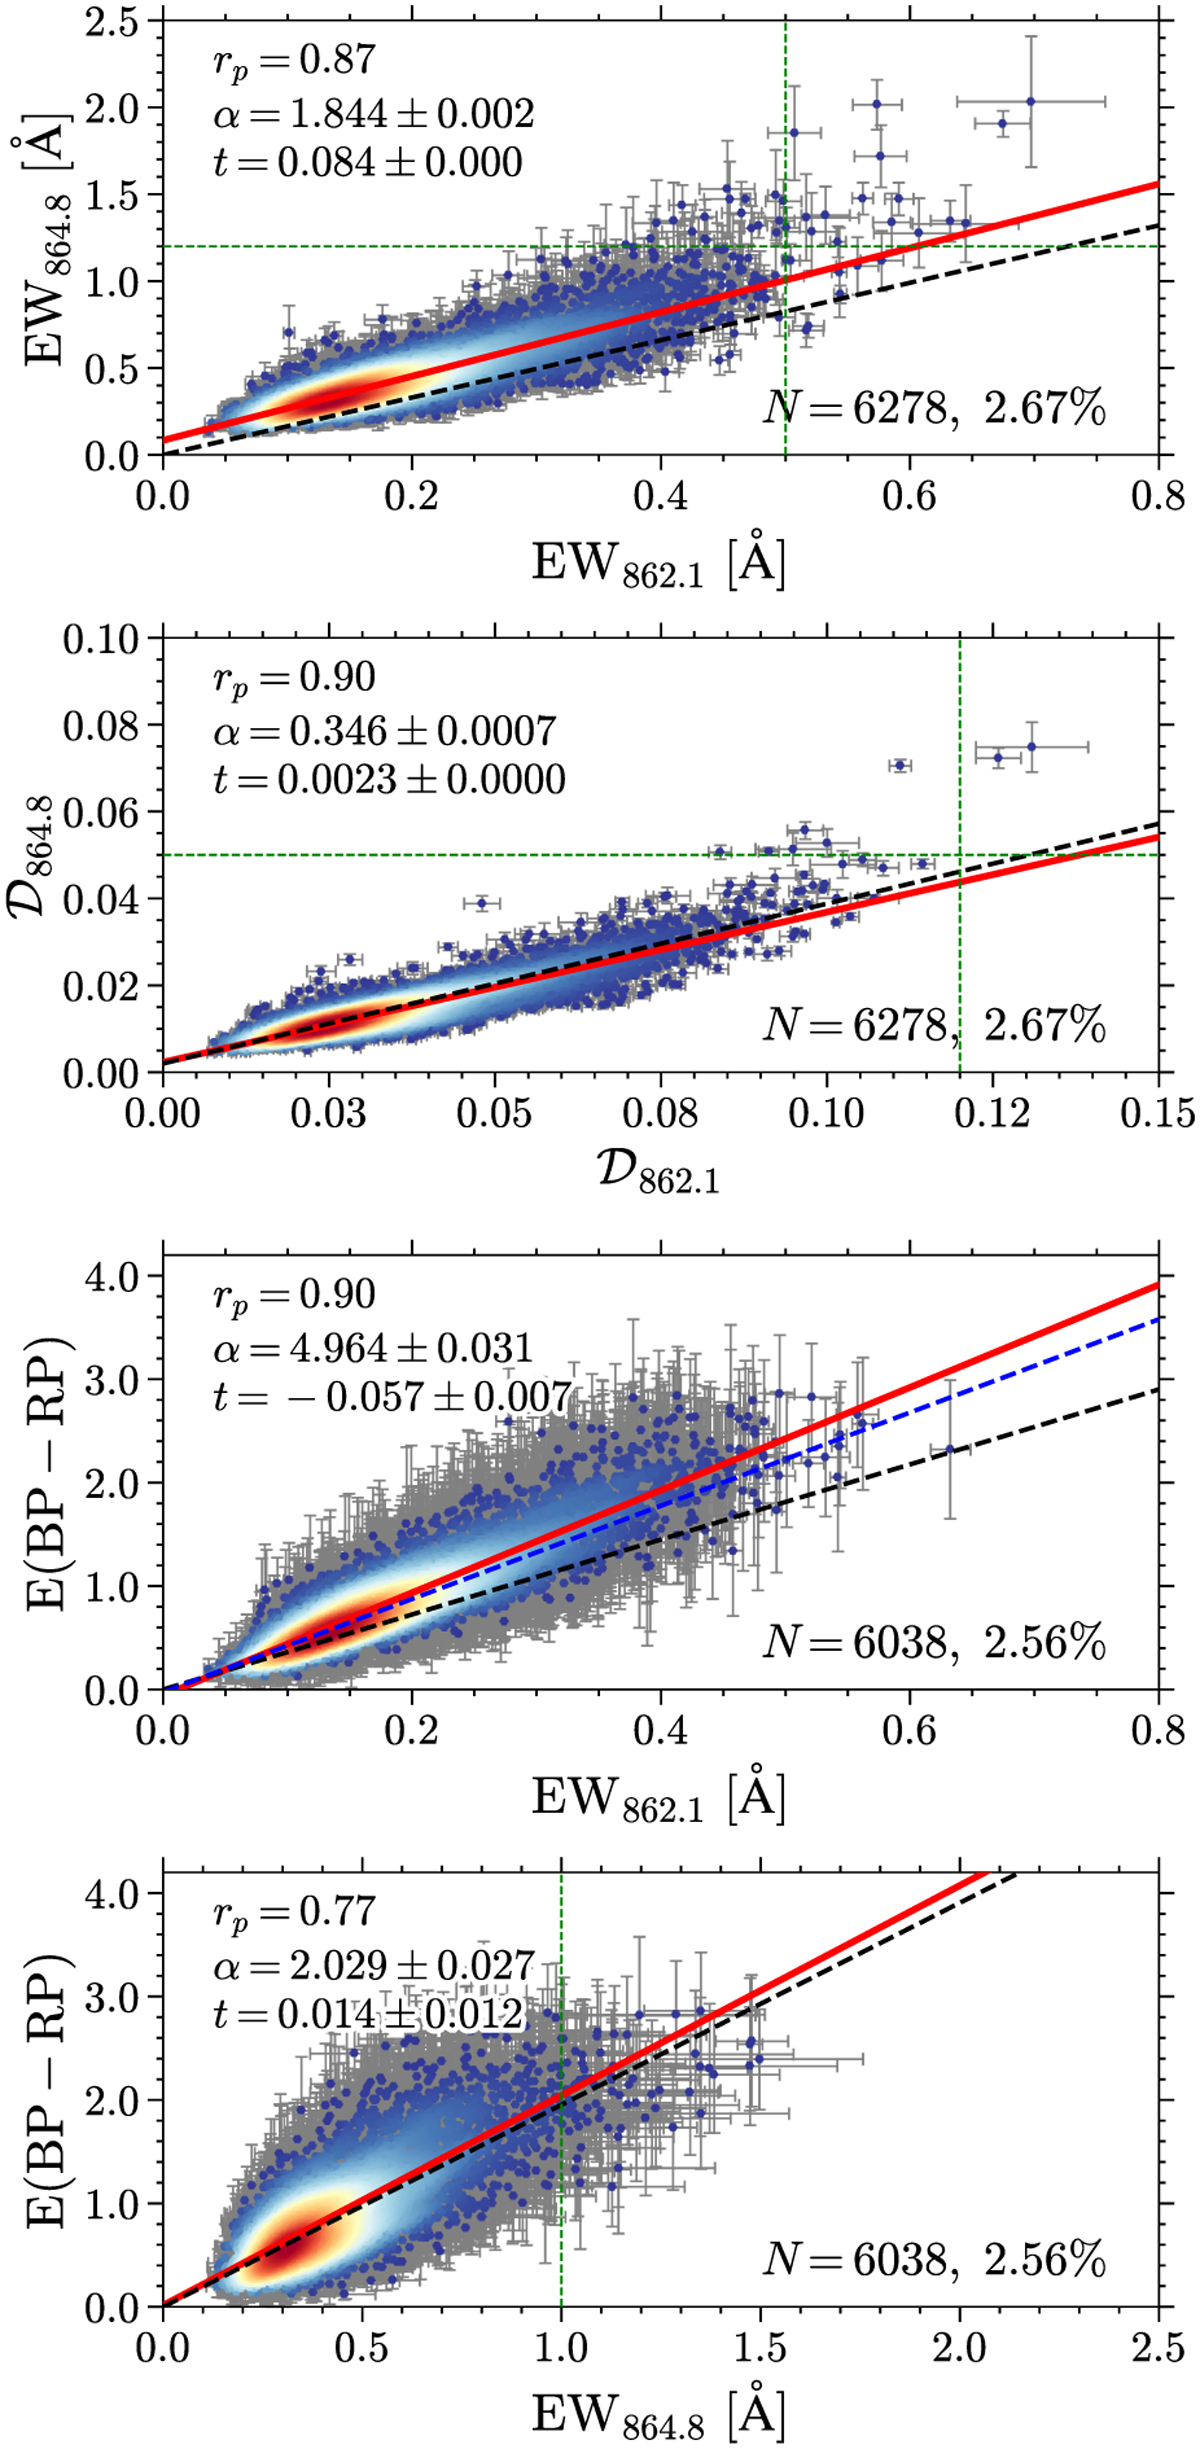
Fig. 21
Download original image
Diverse correlations between λ862.1, λ864.8, and mean E(BP − RP) from GSP-Phot (Andrae et al. 2023) in each voxel. The data points are coloured by their number densities estimated by a Gaussian KDE. The red lines are the linear fit to the data points. The dashed green lines indicate the upper limits on the variables for the linear fits. And the fitted slope (α) and intercept (t) are marked in each panel, together with the Pearson correlation coefficient (rp) and the number of DIB detections (N). Dashed black lines are previous results from Z22, and the dashed blue line is from S23.
Current usage metrics show cumulative count of Article Views (full-text article views including HTML views, PDF and ePub downloads, according to the available data) and Abstracts Views on Vision4Press platform.
Data correspond to usage on the plateform after 2015. The current usage metrics is available 48-96 hours after online publication and is updated daily on week days.
Initial download of the metrics may take a while.