Fig. 17
Download original image
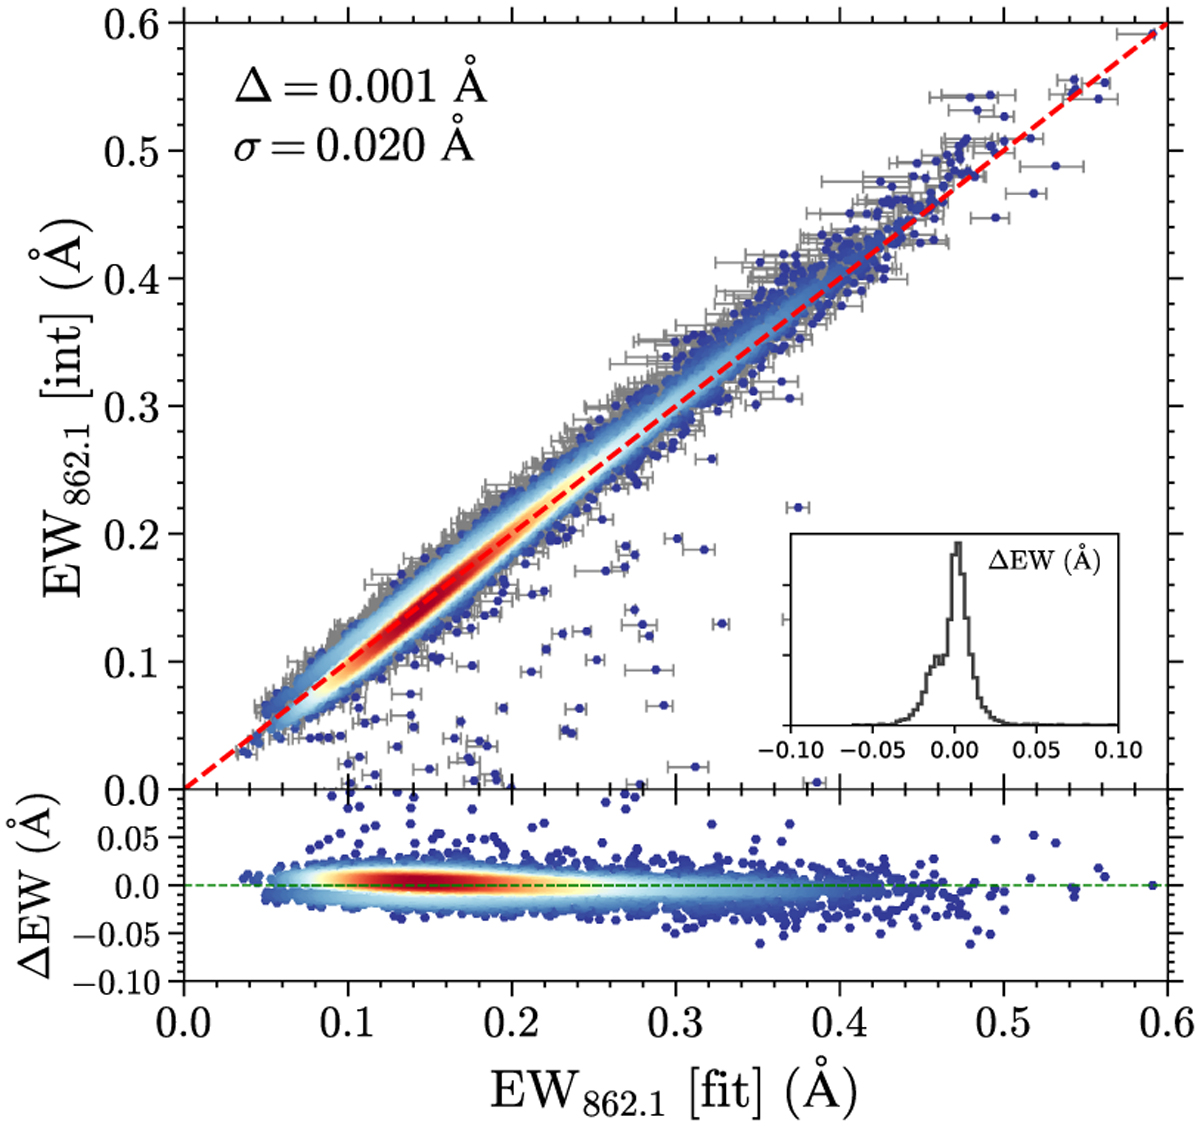
Upper panel: comparison between the fitted and integrated EW862.1. The colour represents the number density (estimated by a Gaussian KDE) of the data points in a linear scale. The grey colour bars show the uncertainty of fitted EW862.1. The dashed red line traces the one-to-one correspondence. A zoom-in panel shows the distribution of the EW difference (ΔEW = EWfit − EWint). The mean (Δ) and standard deviation (σ) of the EW difference are indicated. Lower panel: the distribution EW difference as a function of fitted EW862.1.
Current usage metrics show cumulative count of Article Views (full-text article views including HTML views, PDF and ePub downloads, according to the available data) and Abstracts Views on Vision4Press platform.
Data correspond to usage on the plateform after 2015. The current usage metrics is available 48-96 hours after online publication and is updated daily on week days.
Initial download of the metrics may take a while.