Fig. 14
Download original image
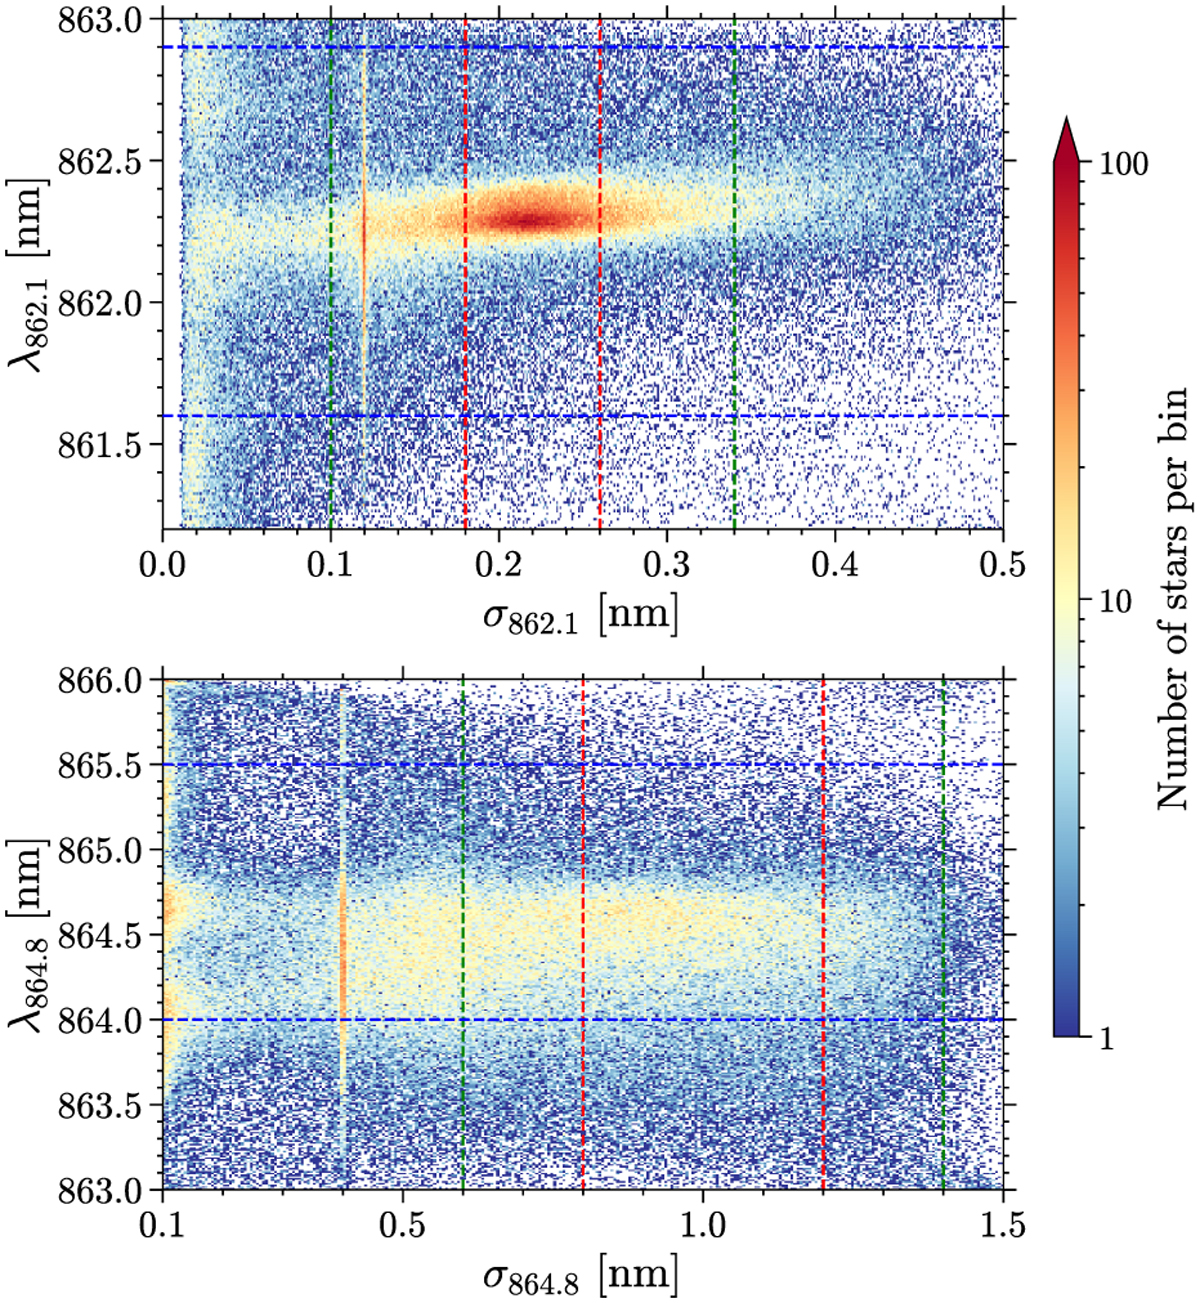
Number density of DIB detections in DIB-Spec as a function of λDIB and σDIB, without any cuts, for λ862.1 (upper panel) and λ864.8 (lower panel). The dashed blue lines indicate the range of permitted λDIB in the QF evaluation (see Sect. 4.1), and the dashed red and green lines correspond to the “best range” and the “secondary range” of σDIB, respectively.
Current usage metrics show cumulative count of Article Views (full-text article views including HTML views, PDF and ePub downloads, according to the available data) and Abstracts Views on Vision4Press platform.
Data correspond to usage on the plateform after 2015. The current usage metrics is available 48-96 hours after online publication and is updated daily on week days.
Initial download of the metrics may take a while.