Fig. 13
Download original image
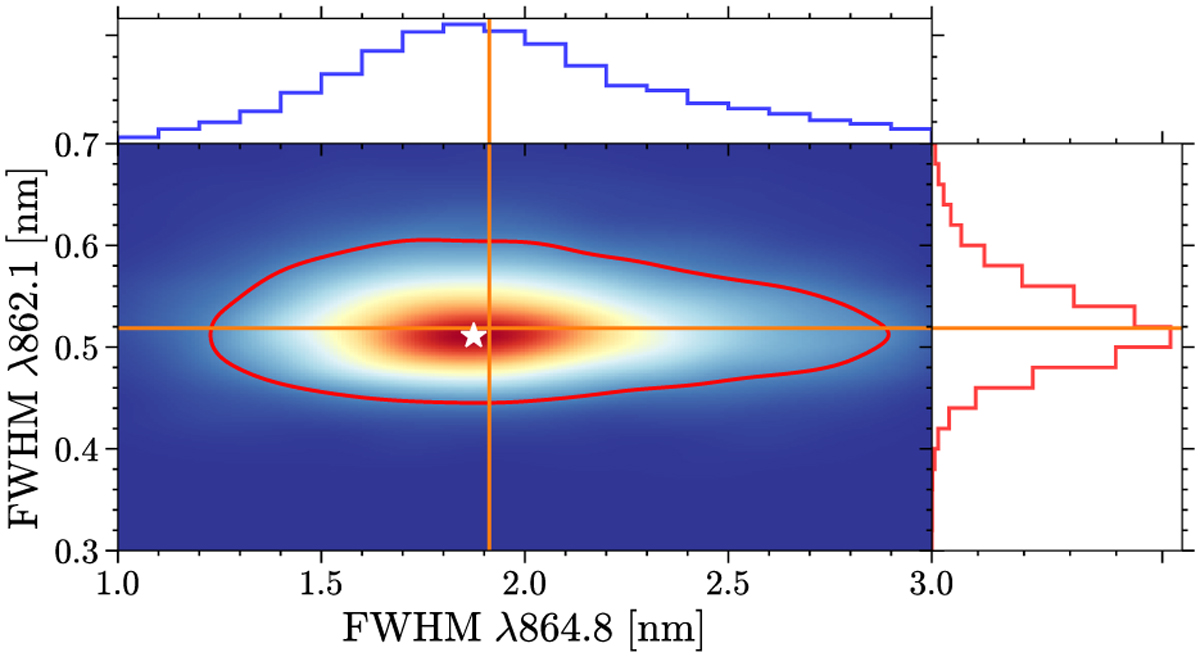
Joint distribution of the FWHM of DIBs λ862.1 and λ864.8, measured in 9778 stacked ISM spectra, with S/N > 100 and 𝒟 > 3RC (see Sect. 4.2), generated by a Gaussian kernel density estimation (KDE). The white star indicates the peak density, and the red line in the central panel indicates the contour of the 2σ level. The orange lines indicate the median FWHM of the two DIBs.
Current usage metrics show cumulative count of Article Views (full-text article views including HTML views, PDF and ePub downloads, according to the available data) and Abstracts Views on Vision4Press platform.
Data correspond to usage on the plateform after 2015. The current usage metrics is available 48-96 hours after online publication and is updated daily on week days.
Initial download of the metrics may take a while.