Fig. 12
Download original image
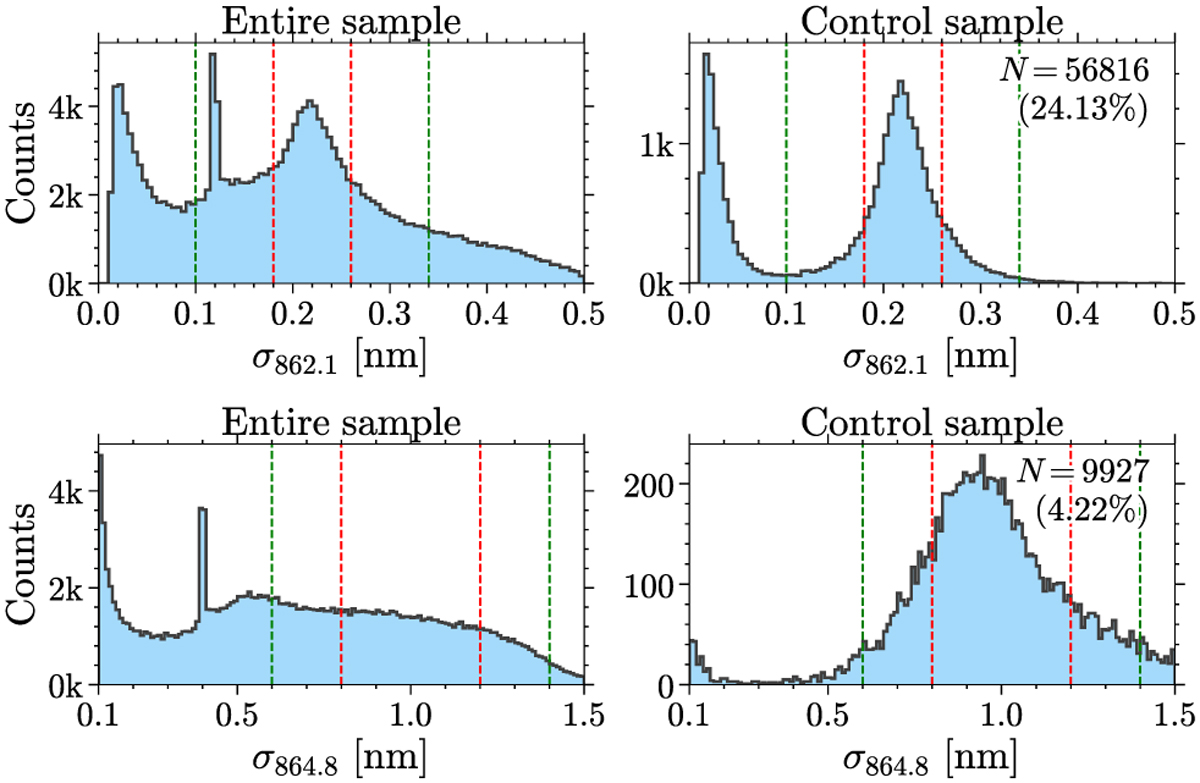
Distribution of σDIB for DIBs λ862.1 and λ864.8 (top and bottom, respectively). The dashed red and green lines correspond to the “best range” and the “secondary range” of σDIB defined in Sect. 4.1 for the DIB QF, respectively. The distribution of the full DIB-Spec results (235 428 voxels) is shown in the left panels, while the right panels show a quality-controlled sample with S/N > 100 and 𝒟 > 3RC (see Sect. 4.2). The latter criterion implies QF values of 0 or 2. The number of detected DIBs and the percentage after the quality control is indicated as well.
Current usage metrics show cumulative count of Article Views (full-text article views including HTML views, PDF and ePub downloads, according to the available data) and Abstracts Views on Vision4Press platform.
Data correspond to usage on the plateform after 2015. The current usage metrics is available 48-96 hours after online publication and is updated daily on week days.
Initial download of the metrics may take a while.