Open Access
Fig. 10
Download original image
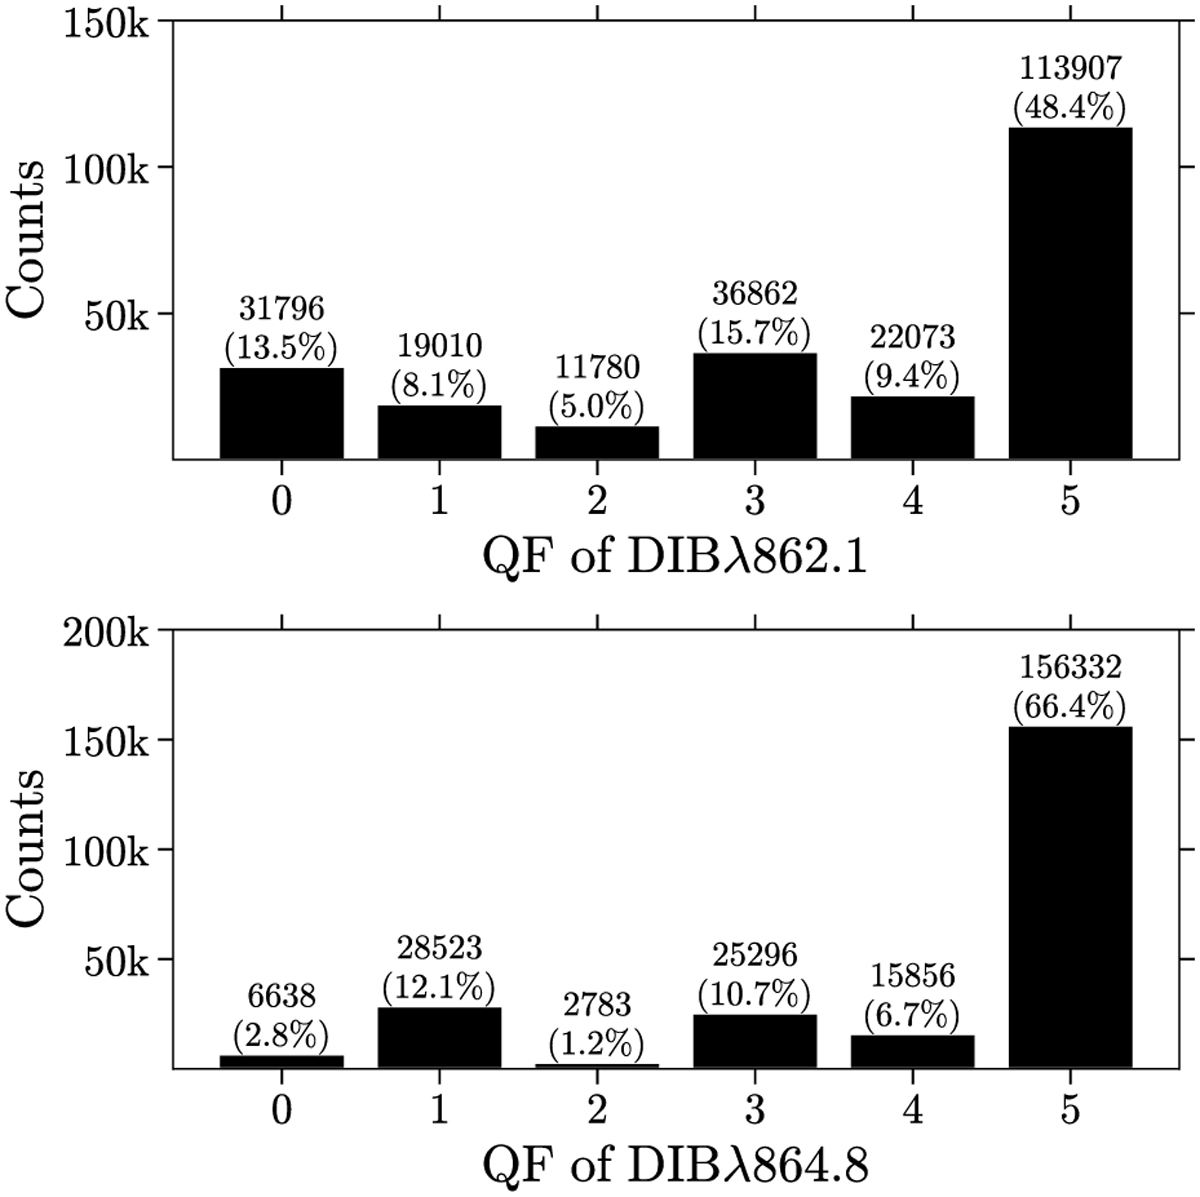
Distribution of DIB quality flags (QFs) at each level (0–5, 0 is the best and 5 is the worst) for DIBs λ862.1 (upper panel) and λ864.8 (lower panel). The number of DIB detections and the fraction are indicated at the top of each bar.
Current usage metrics show cumulative count of Article Views (full-text article views including HTML views, PDF and ePub downloads, according to the available data) and Abstracts Views on Vision4Press platform.
Data correspond to usage on the plateform after 2015. The current usage metrics is available 48-96 hours after online publication and is updated daily on week days.
Initial download of the metrics may take a while.