Fig. 7.
Download original image
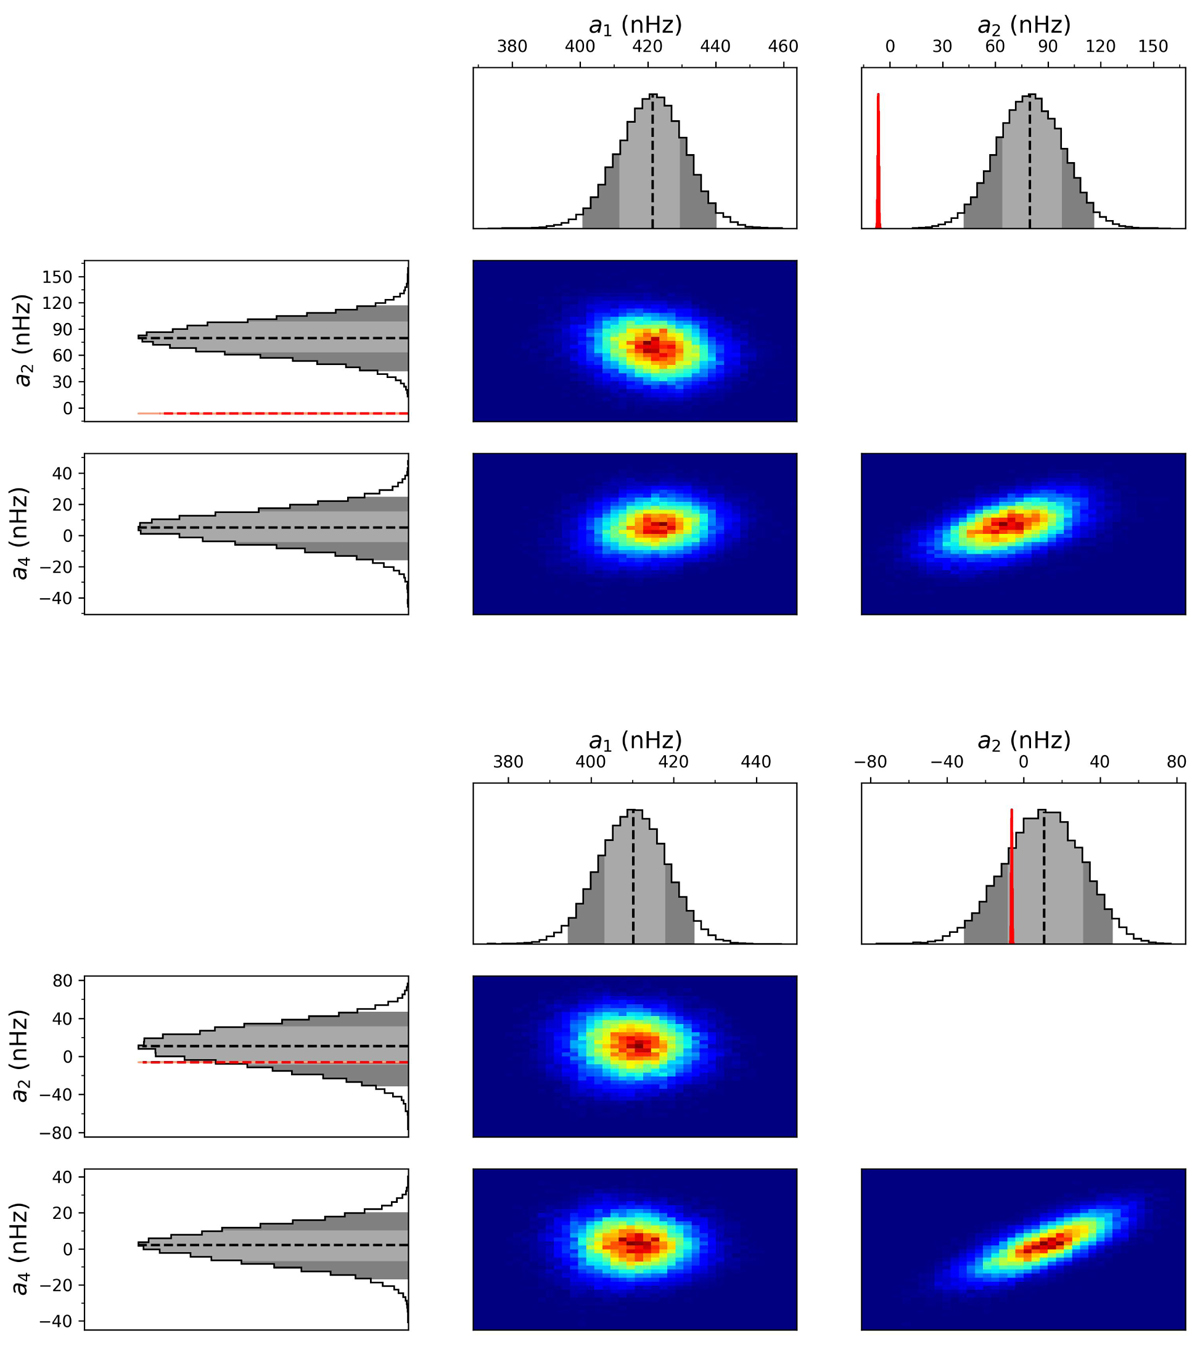
Probability density functions and their correlations obtained by MCMC for coefficients a1, a2, a3, and a4 for the Sun at maximum activity (1999–2002, left) and at minimum activity (2006–2009, right). The red curve is the expected ![]() coefficient for a pure centrifugal distortion. The light and dark grey PDF areas show the 1σ and 2σ confidence intervals, respectively.
coefficient for a pure centrifugal distortion. The light and dark grey PDF areas show the 1σ and 2σ confidence intervals, respectively.
Current usage metrics show cumulative count of Article Views (full-text article views including HTML views, PDF and ePub downloads, according to the available data) and Abstracts Views on Vision4Press platform.
Data correspond to usage on the plateform after 2015. The current usage metrics is available 48-96 hours after online publication and is updated daily on week days.
Initial download of the metrics may take a while.