Fig. 5.
Download original image
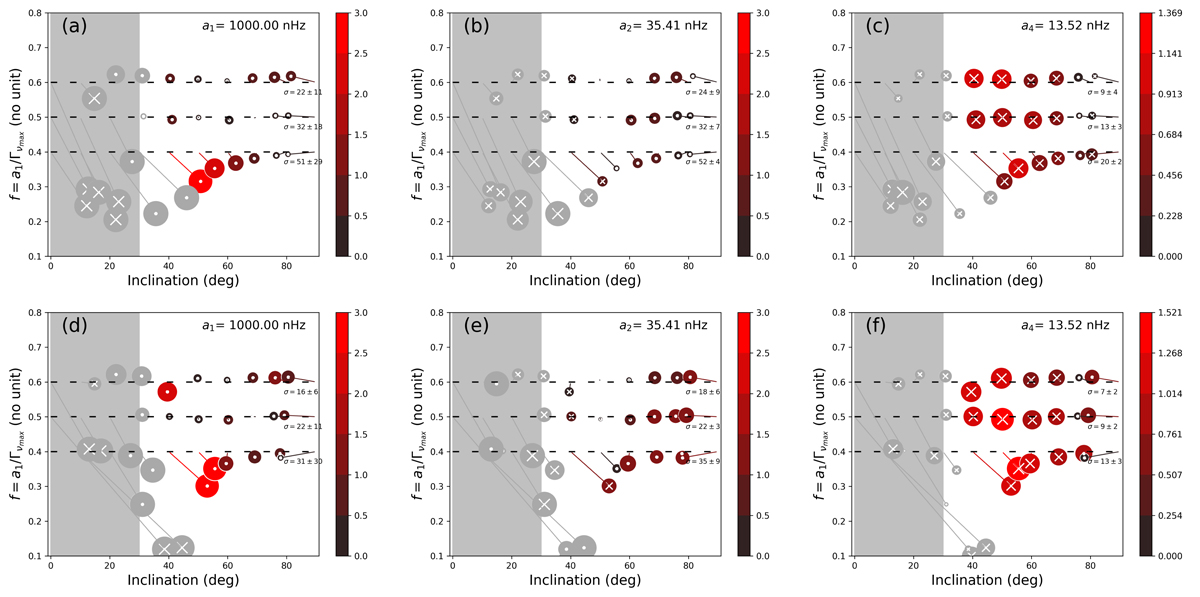
Bias analysis for ![]() for an equatorial activity band (θ0 = 85°, δ = 10°) with similar intensity to the Sun (ϵnl = 5 × 10⁻⁴) for Tobs = 2 years (top) and Tobs = 4 years (bottom). The colour and size of the circles indicate the modulus of the bias. The colour bar gives its scale normalised by the uncertainty, b(aj)/σ. A white cross indicates an underestimation. A white dot is for an overestimation. Below 30° of inclination (grey area and symbols), the results are not reliable.
for an equatorial activity band (θ0 = 85°, δ = 10°) with similar intensity to the Sun (ϵnl = 5 × 10⁻⁴) for Tobs = 2 years (top) and Tobs = 4 years (bottom). The colour and size of the circles indicate the modulus of the bias. The colour bar gives its scale normalised by the uncertainty, b(aj)/σ. A white cross indicates an underestimation. A white dot is for an overestimation. Below 30° of inclination (grey area and symbols), the results are not reliable.
Current usage metrics show cumulative count of Article Views (full-text article views including HTML views, PDF and ePub downloads, according to the available data) and Abstracts Views on Vision4Press platform.
Data correspond to usage on the plateform after 2015. The current usage metrics is available 48-96 hours after online publication and is updated daily on week days.
Initial download of the metrics may take a while.