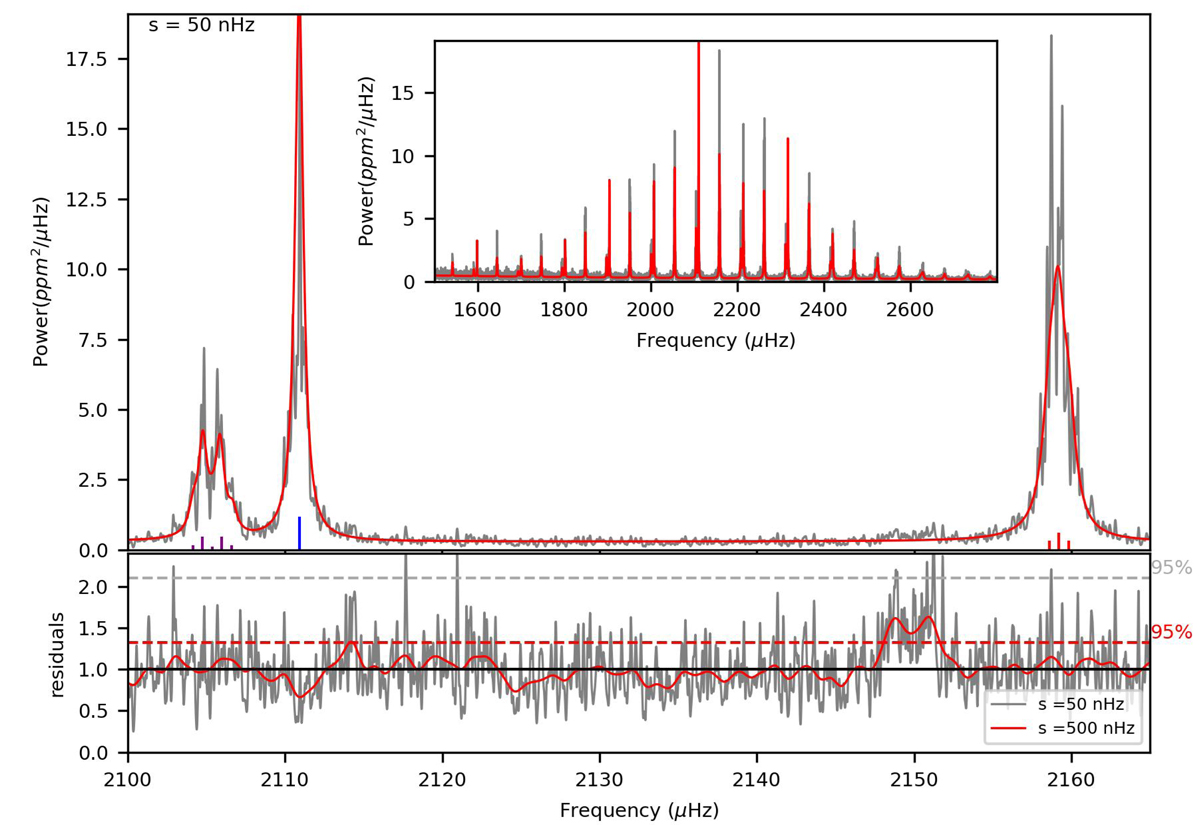
Fig. E.3.
Download original image
Same as Figure E.1 but for 16 Cyg A. Top panel: Highlight of a l = 2, 0, 1 mode group (left to right) and their fit (red). A very mild power asymmetry is seen in the l = 2 data. Top panel, inset: Overall view of the power spectrum. Bottom panel: Residual of the fit with two levels of Gaussian smoothing. The residual shows an excess of power due to the low HNR≃1.7 l = 3 (not fitted here).
Current usage metrics show cumulative count of Article Views (full-text article views including HTML views, PDF and ePub downloads, according to the available data) and Abstracts Views on Vision4Press platform.
Data correspond to usage on the plateform after 2015. The current usage metrics is available 48-96 hours after online publication and is updated daily on week days.
Initial download of the metrics may take a while.