Fig. E.2.
Download original image
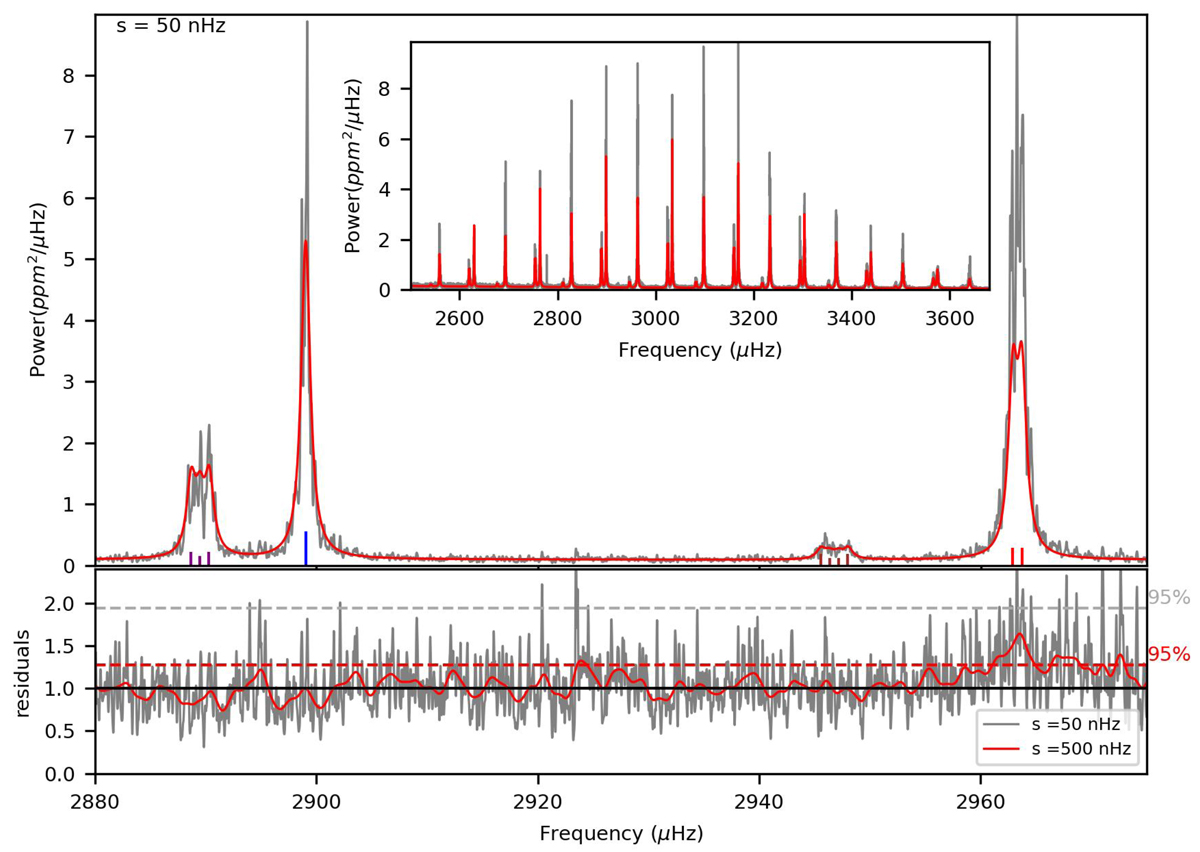
Same as Figure E.1 but between 2006 and 2009. Top panel: Highlight of a l = 2, 0, 3, 1 mode group (left to right) and their fit (red). The power asymmetry seen for 1999-2002 is not apparent in the data. Top panel, inset: Overall view of the power spectrum. Bottom panel: Residual of the fit with two levels of Gaussian smoothing. The residual on l = 1 is a bit high due to the visibility being fixed for all modes.
Current usage metrics show cumulative count of Article Views (full-text article views including HTML views, PDF and ePub downloads, according to the available data) and Abstracts Views on Vision4Press platform.
Data correspond to usage on the plateform after 2015. The current usage metrics is available 48-96 hours after online publication and is updated daily on week days.
Initial download of the metrics may take a while.