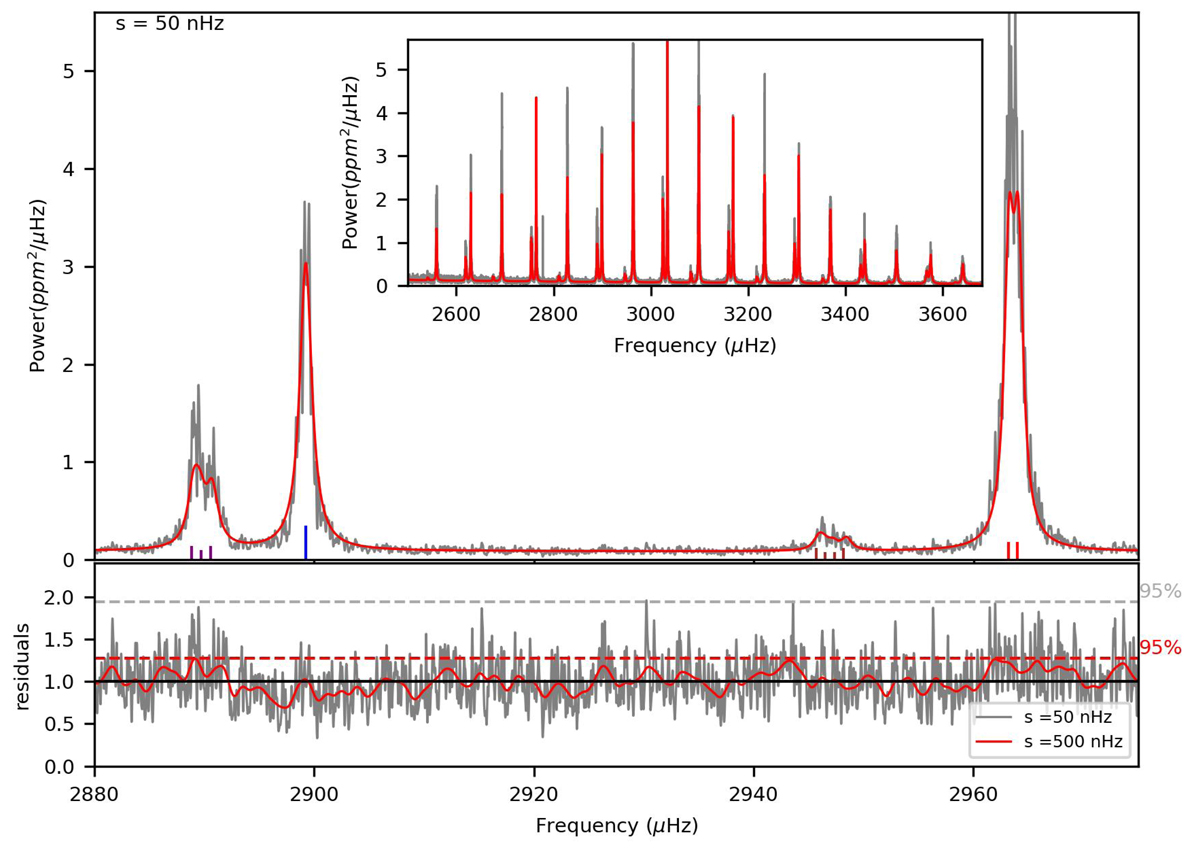
Fig. E.1.
Download original image
Solar power spectrum for observation between 1999 and 2002 after Gaussian smoothing over a kernel width s = 50nHz. Superimposed is the best MCMC fit. Top panel: Highlight of a l = 2, 0, 3, 1 mode group (left to right) and their fit (red). The power asymmetry due to non-symmetric m-components is visible in the data. Top panel, inset: Overall view of the modes. Bottom panel: Residual of the fit with two levels of Gaussian smoothing.
Current usage metrics show cumulative count of Article Views (full-text article views including HTML views, PDF and ePub downloads, according to the available data) and Abstracts Views on Vision4Press platform.
Data correspond to usage on the plateform after 2015. The current usage metrics is available 48-96 hours after online publication and is updated daily on week days.
Initial download of the metrics may take a while.