Fig. 9.
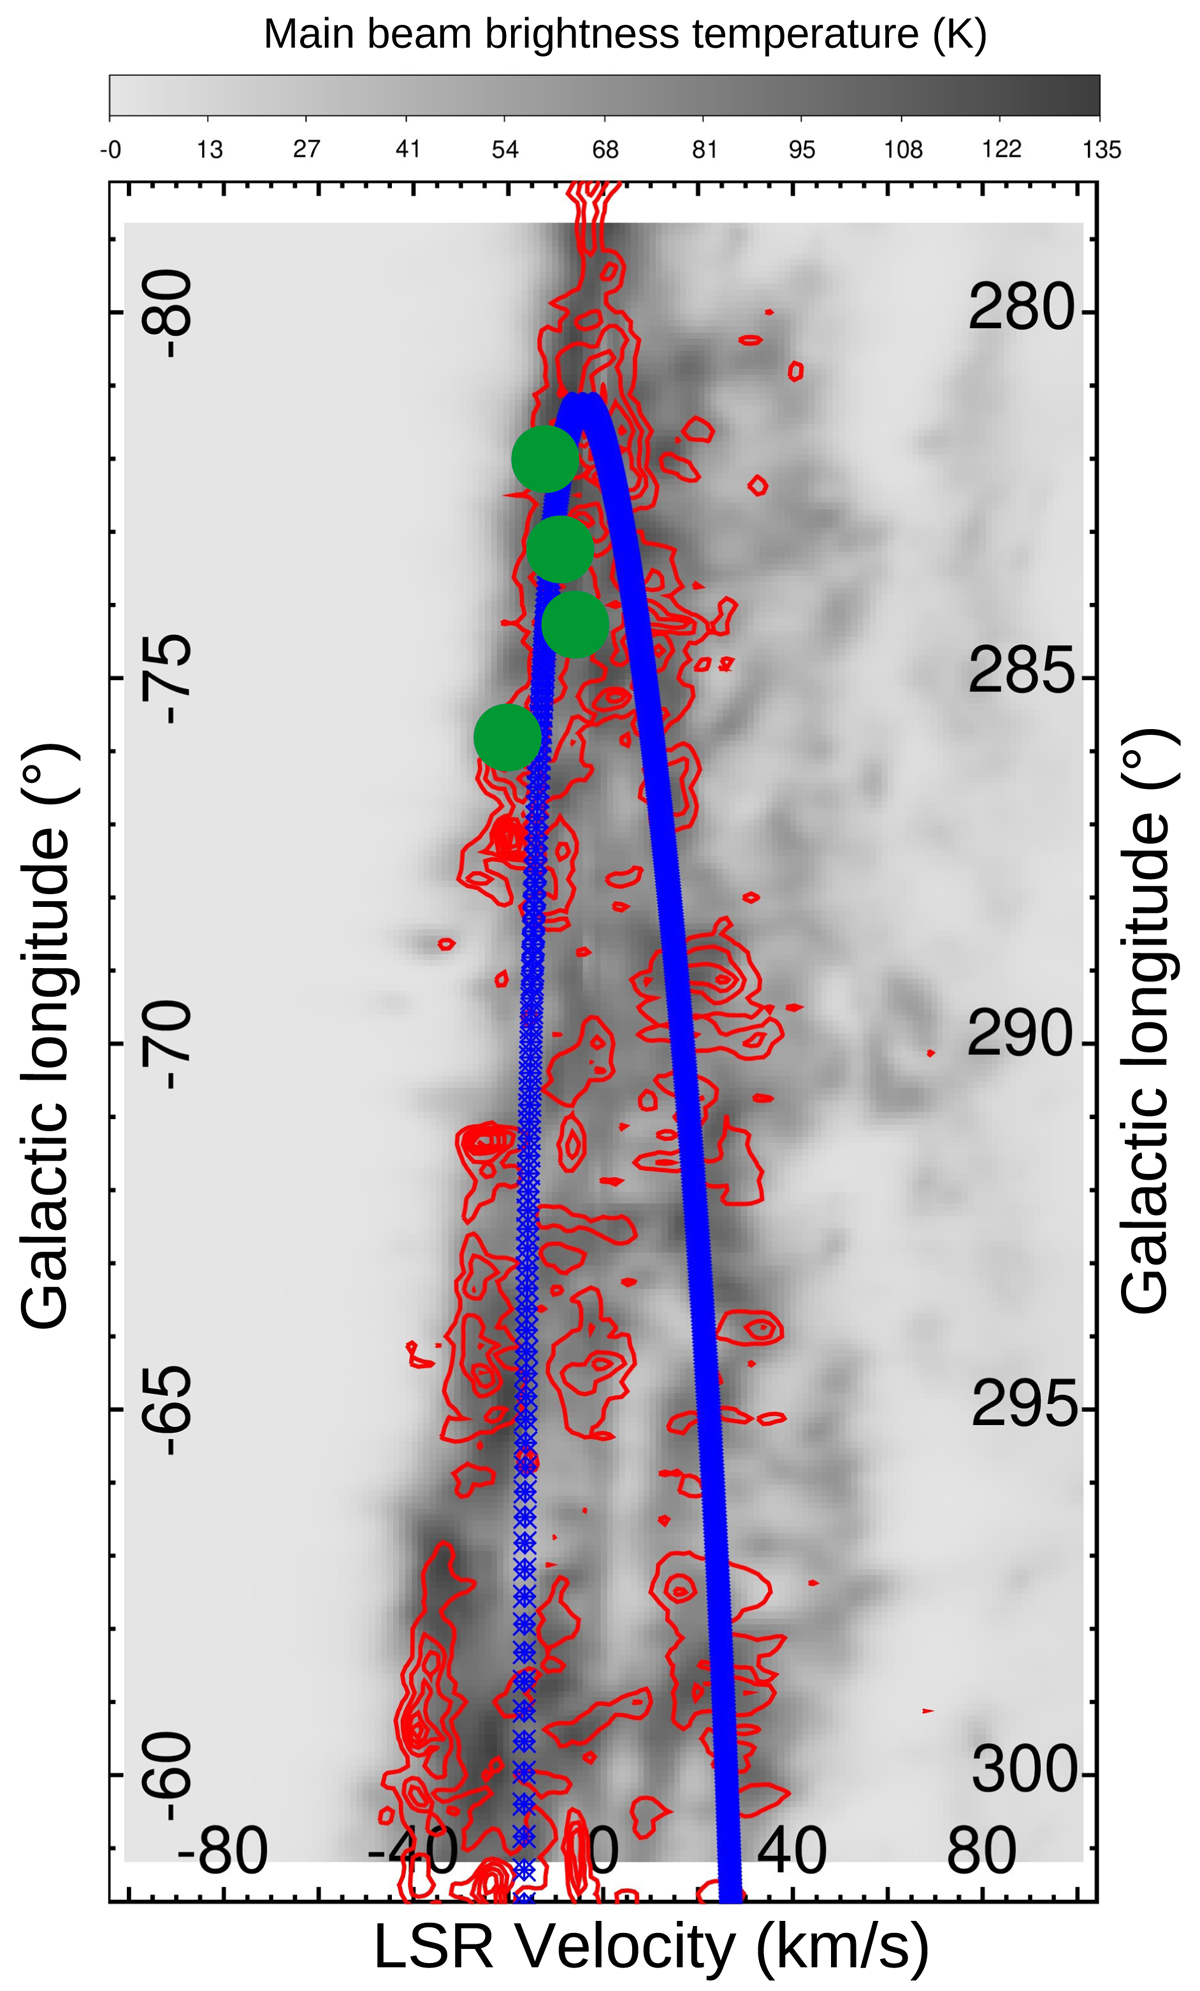
Download original image
Longitude–velocity plot of the CO emission from Dame et al. (2001; integrated over latitudes of between 0 and −1.2°) overplotted with HI emission from the HI4PI project (HI4PI Collaboration 2016). In blue, we show the plot of the Carina arm from the Hou & Han (2015) model. The green symbols show the position of the H II regions RCW 46, RCW 48, RCW 49, and G30 (ordered by increasing longitude).
Current usage metrics show cumulative count of Article Views (full-text article views including HTML views, PDF and ePub downloads, according to the available data) and Abstracts Views on Vision4Press platform.
Data correspond to usage on the plateform after 2015. The current usage metrics is available 48-96 hours after online publication and is updated daily on week days.
Initial download of the metrics may take a while.