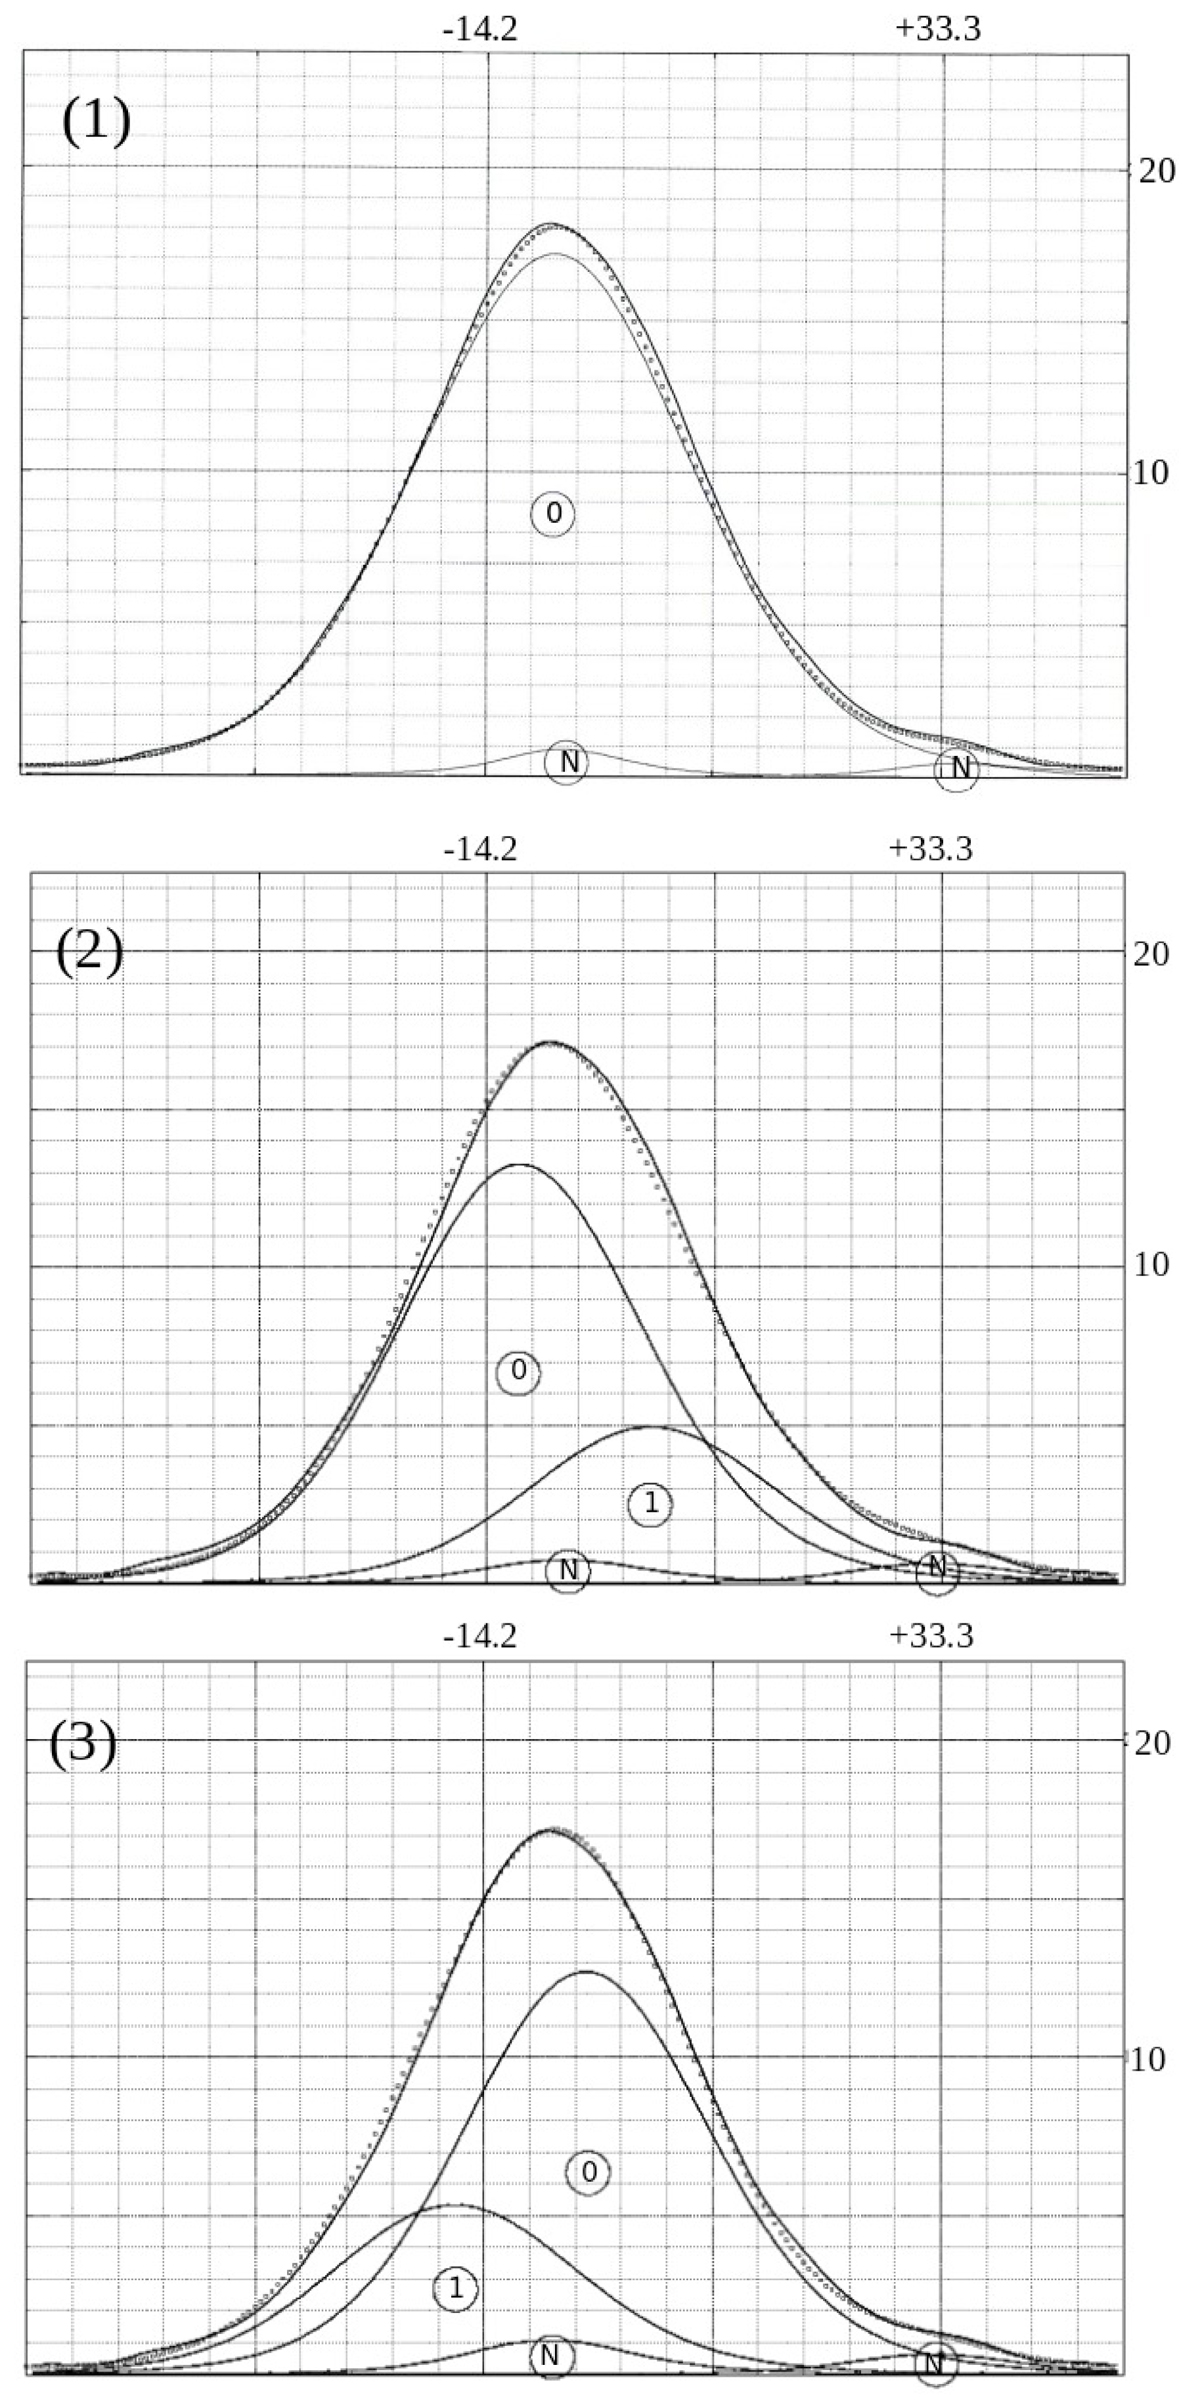
Fig. 8.
Download original image
Hα profile from RCW50. The profile can be decomposed in three ways (panels 1–3). The axes are the VLSR in km s−1 (X axis) and intensity in arbitrary units (Y axis). The profile, in addition to the night sky lines (labeled “N”), can be decomposed into either one component (panel 1) or two components (panels 2 and 3), labeled “0” and “1”. The solid and dash dotted lines are the observed and the fitted profiles, respectively.
Current usage metrics show cumulative count of Article Views (full-text article views including HTML views, PDF and ePub downloads, according to the available data) and Abstracts Views on Vision4Press platform.
Data correspond to usage on the plateform after 2015. The current usage metrics is available 48-96 hours after online publication and is updated daily on week days.
Initial download of the metrics may take a while.