Fig. 7.
Download original image
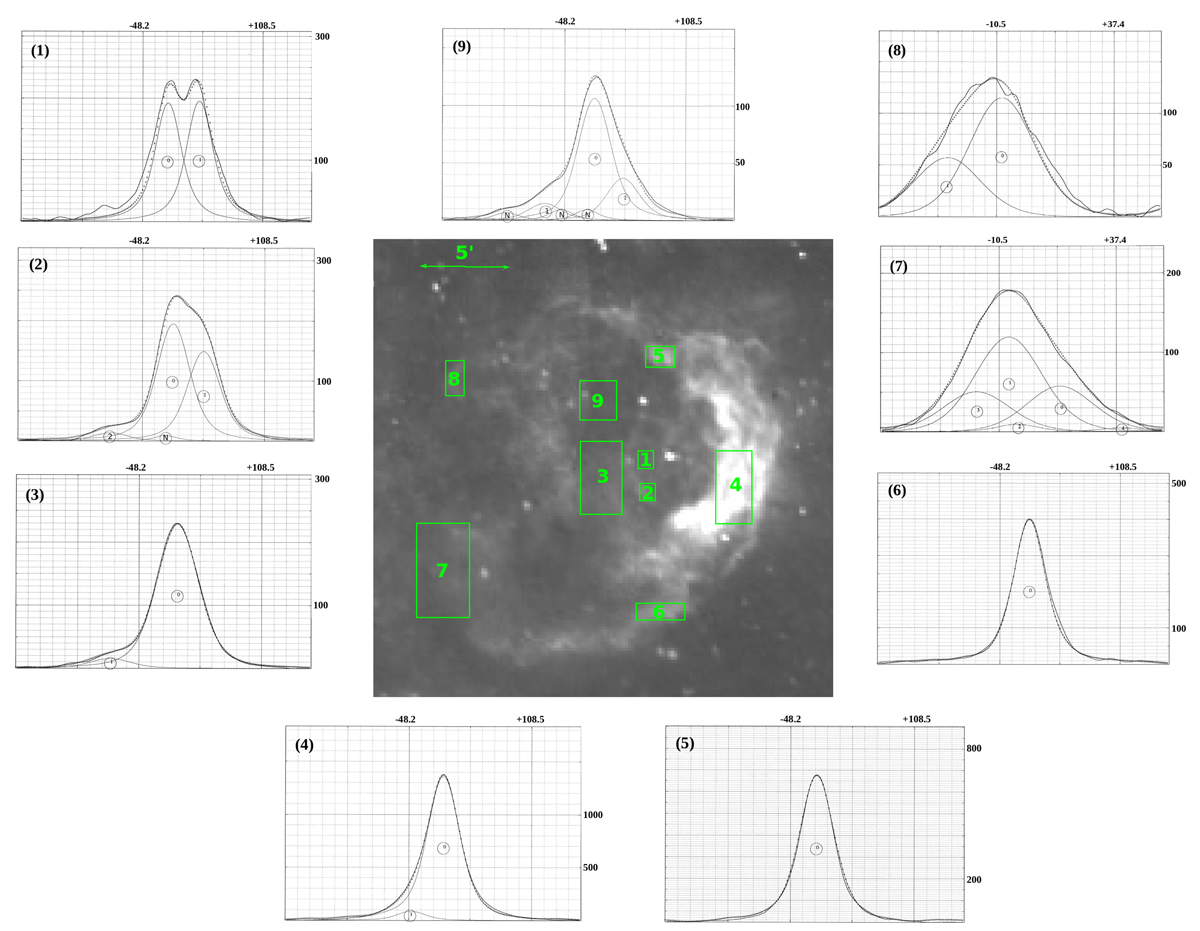
Representative Hα profiles from RCW 48 are shown all around the displayed Hα image. The Hα profiles are extracted from the areas delineated on the image. The axes are the VLSR in km s−1 (X axis) and intensity in arbitrary units (Y axis). The profiles are decomposed into one to three components (labeled “0” to “2”) and night sky lines (labeled “N”), when necessary. The solid and dash dotted lines are the observed and the fitted profiles, respectively. All profiles, except (7) and (8), were observed with the P = 796 interferometer.
Current usage metrics show cumulative count of Article Views (full-text article views including HTML views, PDF and ePub downloads, according to the available data) and Abstracts Views on Vision4Press platform.
Data correspond to usage on the plateform after 2015. The current usage metrics is available 48-96 hours after online publication and is updated daily on week days.
Initial download of the metrics may take a while.