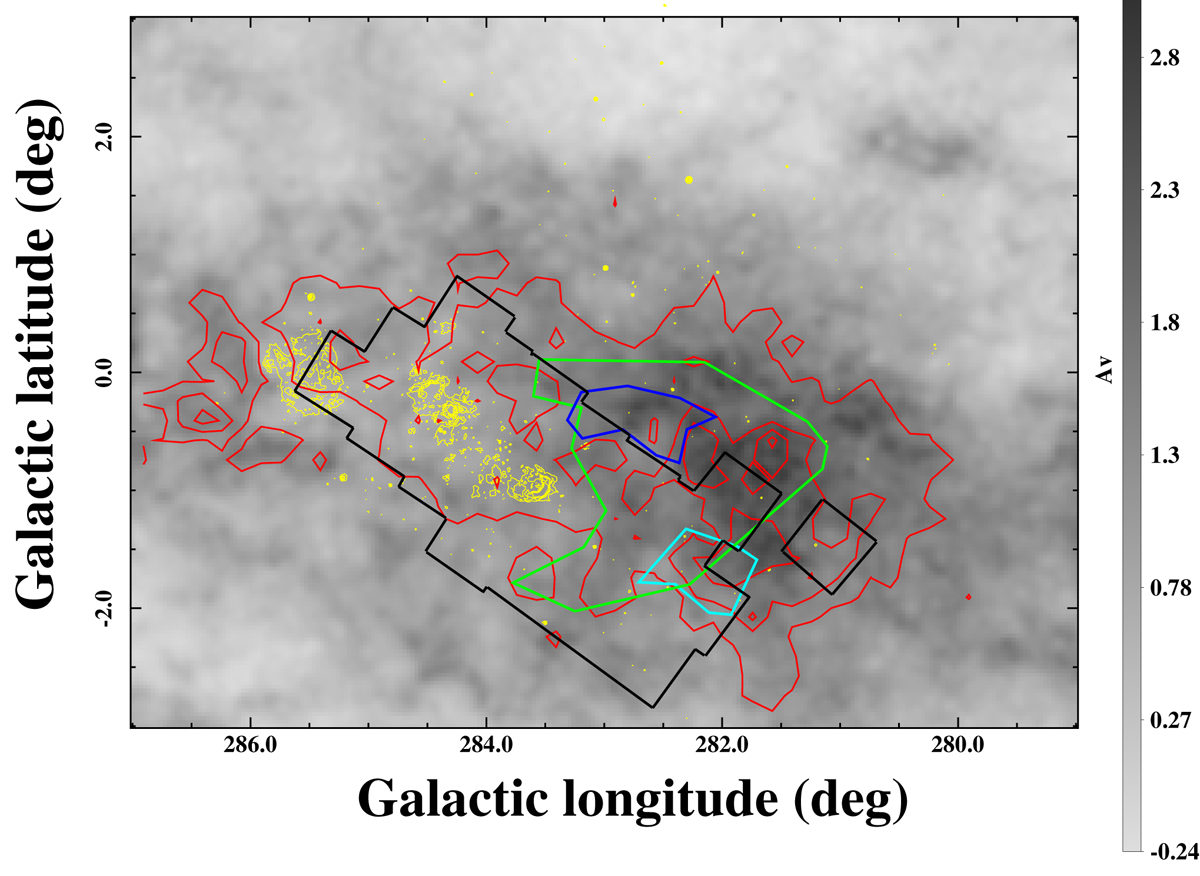
Fig. 3.
Download original image
Av extinction map (Dobashi et al. 2013). The red isocontours are AKs of 0.65, 1.55, 2.44, and 3.34 mag, respectively. The blue, green, and cyan contours underline extinction features at 2, 5, and 9.5 kpc respectively, delineated from Marshall et al. (2006) extinction data cubes. The Hα mosaic contour is drawn in black and the Hα emission of the main H II regions is displayed (from the larger-scale SuperCOSMOS Hα Survey (SHS) image) as yellow isocontours.
Current usage metrics show cumulative count of Article Views (full-text article views including HTML views, PDF and ePub downloads, according to the available data) and Abstracts Views on Vision4Press platform.
Data correspond to usage on the plateform after 2015. The current usage metrics is available 48-96 hours after online publication and is updated daily on week days.
Initial download of the metrics may take a while.