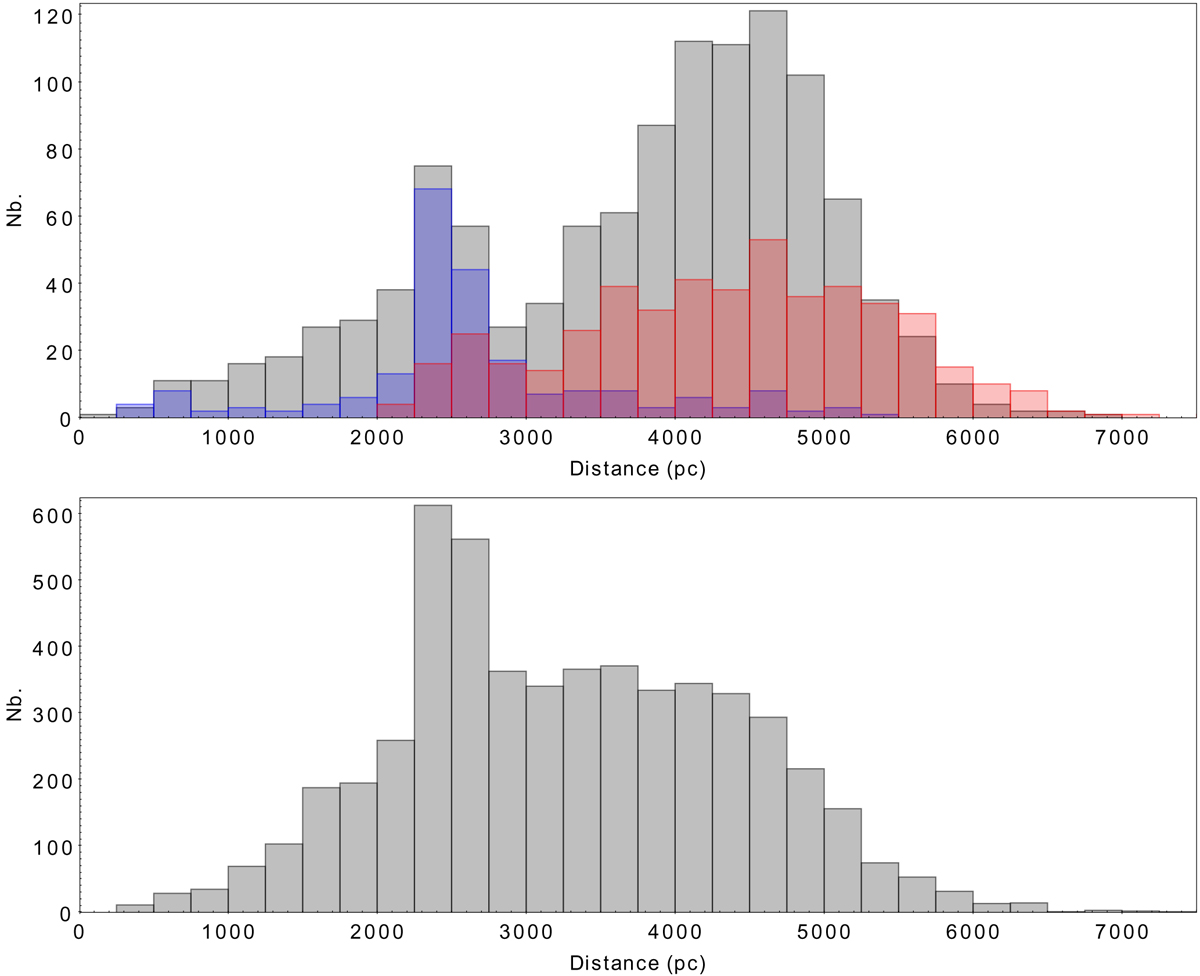
Fig. 11.
Download original image
Histograms of the Gaia distances of different samples. Upper panel: histogram of the Gaia distance of OB star candidates (between 282° and 285.5°) from Mohr-Smith et al. (2017; grey) overplotted with the Xu et al. (2021; blue) and Chen et al. (2019) OB stars samples (red). Lower panel: histogram of the Gaia distances of the OBA star sample from Zari et al. (2021). All stars follow RUWE ≤ 1.4 and π/σπ > 5).
Current usage metrics show cumulative count of Article Views (full-text article views including HTML views, PDF and ePub downloads, according to the available data) and Abstracts Views on Vision4Press platform.
Data correspond to usage on the plateform after 2015. The current usage metrics is available 48-96 hours after online publication and is updated daily on week days.
Initial download of the metrics may take a while.