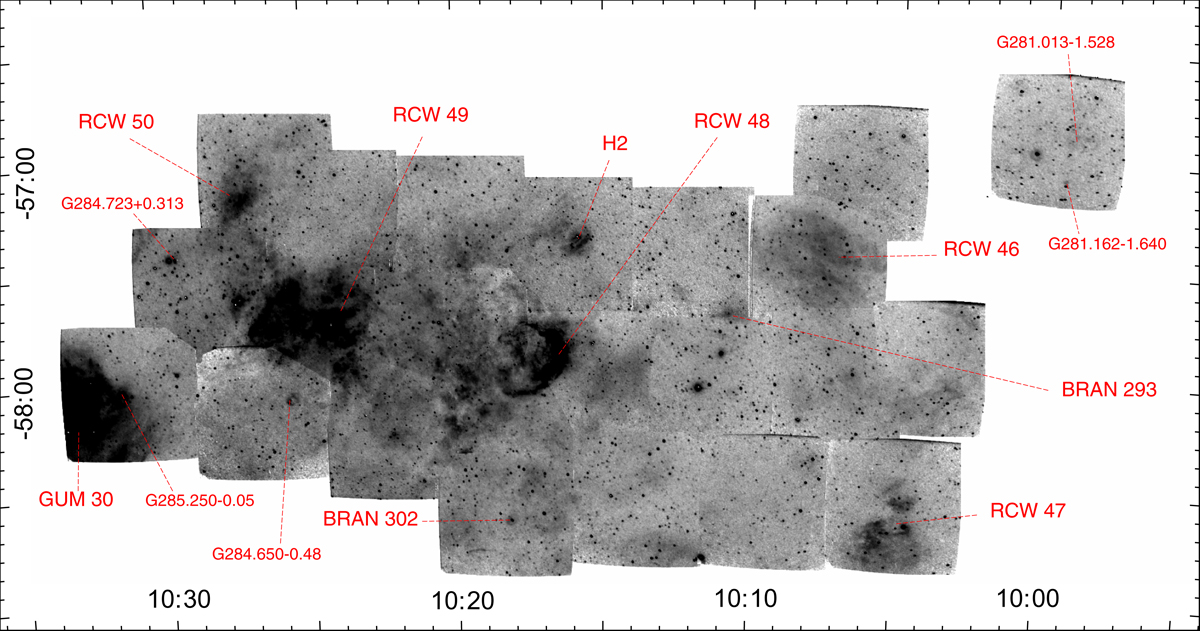
Fig. 1.
Download original image
General view of the covered area (the J2000 coordinates are in h:m and °:′ format, respectively). This Hα image is a mosaic of the images obtained by adding all the planes of the observed datacubes. The contrast has been chosen to highlight the diffuse emission structures. The names of the main optical H II regions are given in red.
Current usage metrics show cumulative count of Article Views (full-text article views including HTML views, PDF and ePub downloads, according to the available data) and Abstracts Views on Vision4Press platform.
Data correspond to usage on the plateform after 2015. The current usage metrics is available 48-96 hours after online publication and is updated daily on week days.
Initial download of the metrics may take a while.