Fig. 7
Download original image
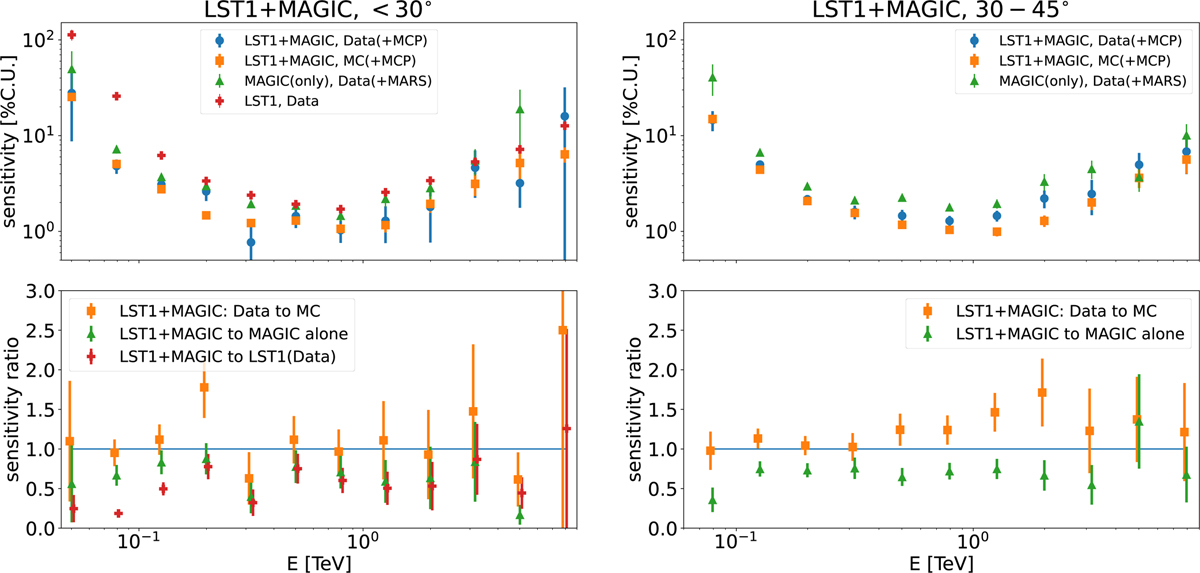
Sensitivity in the units of Crab Nebula flux percentage of the joint LST-1+MAGIC analysis with MCP from the Crab observations (blue circles) and MC simulations (orange squares) compared to MAGIC-only analysis using MARS (green triangles) and LST-1 sensitivity (red crosses. Abe et al. 2023). Left panels: zenith distance range of <30°, while the right panels for 30–45°. Bottom panel: ratio of sensitivity values of the joint analysis sensitivity to MAGIC-only (green triangles) and LST-1-only (red crosses), as well as with respect to the MC sensitivity performance (orange squares); e.g., the green points shows that the three-telescope system, relative to MAGIC alone, can in average detect sources with a flux ~30% lower. For visibility in the bottom panels, the points are shifted by ±2% on the X scale.
Current usage metrics show cumulative count of Article Views (full-text article views including HTML views, PDF and ePub downloads, according to the available data) and Abstracts Views on Vision4Press platform.
Data correspond to usage on the plateform after 2015. The current usage metrics is available 48-96 hours after online publication and is updated daily on week days.
Initial download of the metrics may take a while.