Fig. 4
Download original image
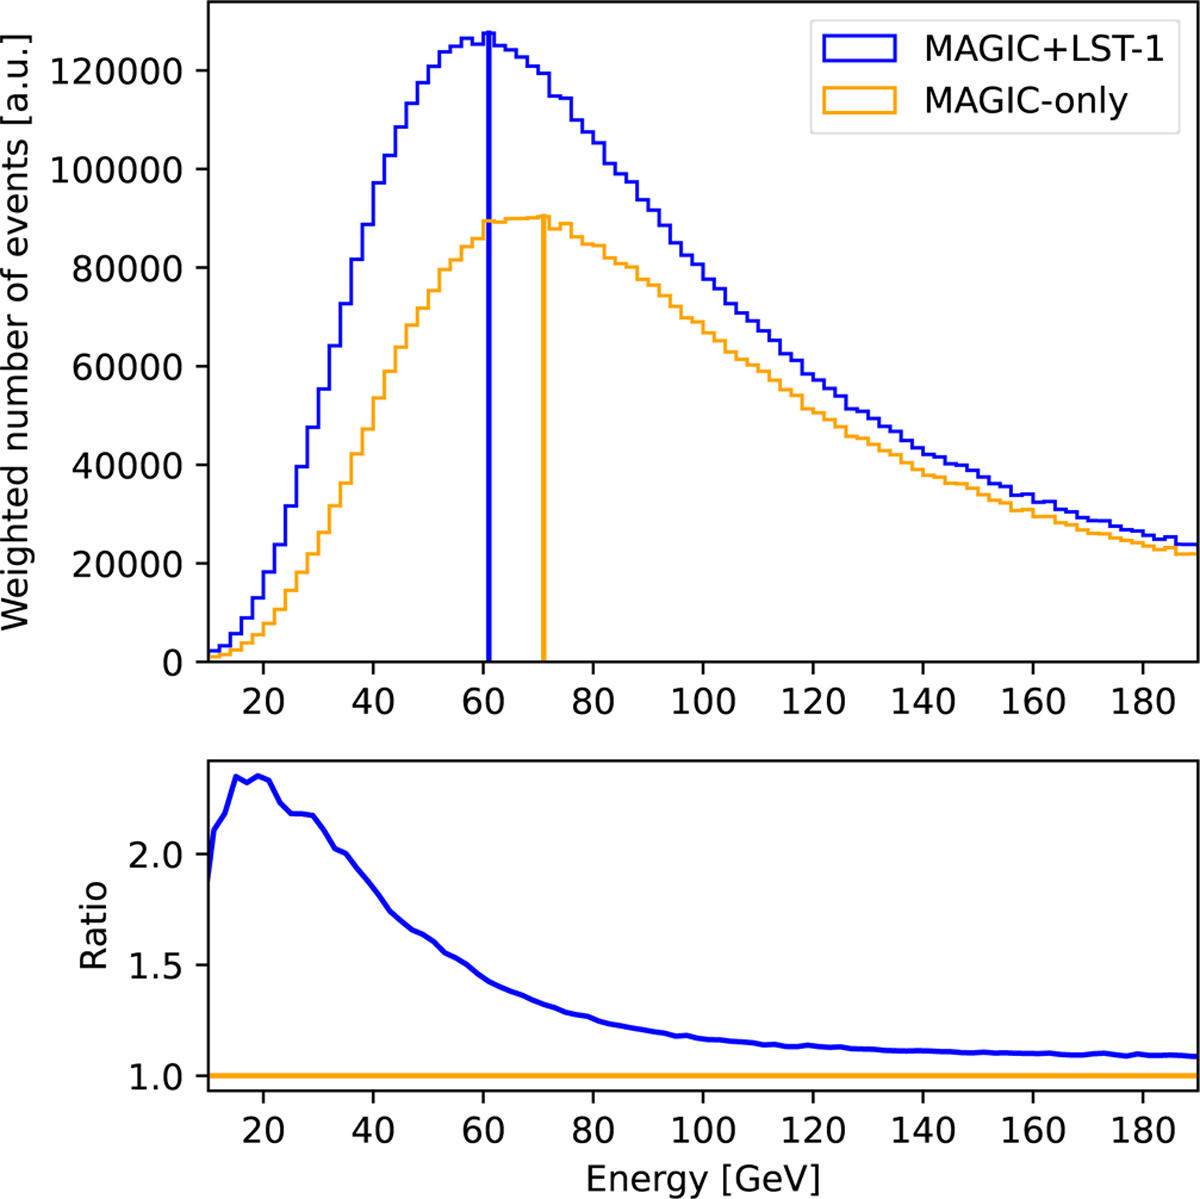
True energy distribution obtained with MC simulations (weighted to a source spectrum of −2.6) of gamma rays for Zd < 30° at the reconstruction level (at least two images with an intensity of >50). Vertical lines show the peak position for the joint analysis (blue) and MAGIC-only analysis (orange). Bottom panel shows the ratio of the two curves.
Current usage metrics show cumulative count of Article Views (full-text article views including HTML views, PDF and ePub downloads, according to the available data) and Abstracts Views on Vision4Press platform.
Data correspond to usage on the plateform after 2015. The current usage metrics is available 48-96 hours after online publication and is updated daily on week days.
Initial download of the metrics may take a while.