Fig. 3
Download original image
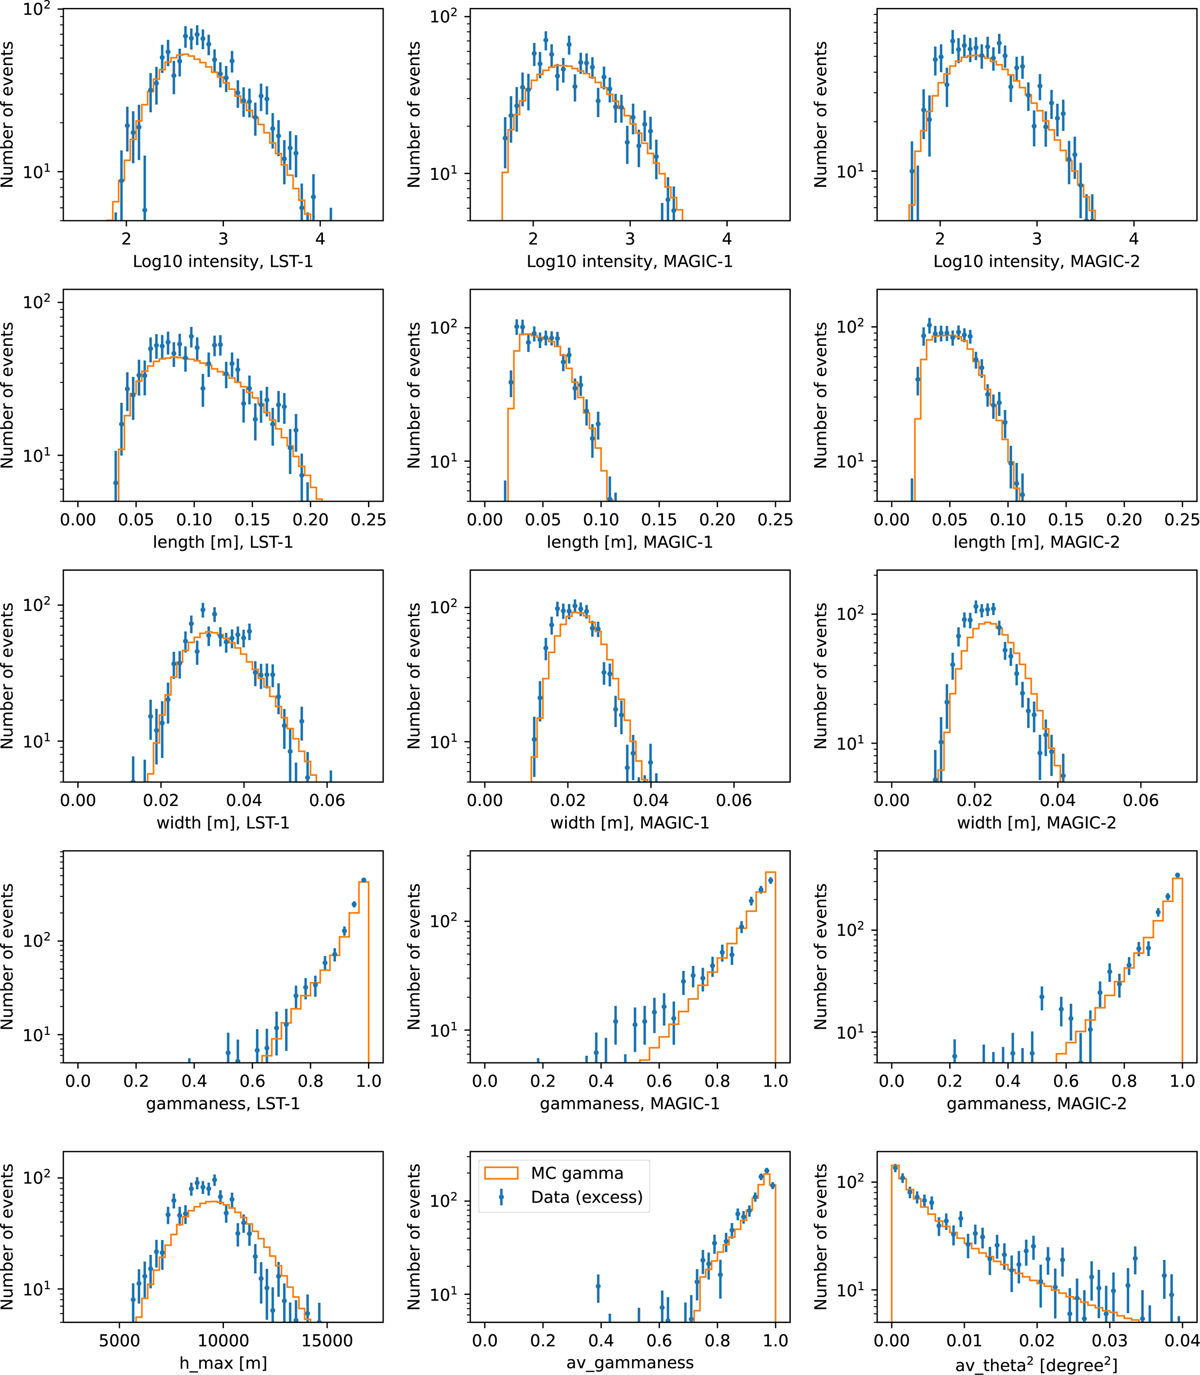
Comparison of image parameters between the gamma-ray excess in the data (blue) and MC simulations of gamma rays (orange). Only observations with zenith distance below 30° are used. The top four rows of panels show intensity, length, width, and individual telescope “gammaness” (from top to bottom) for LST-1 (left), MAGIC-I (middle), and MAGIC-II (right). The bottom row shows stereoscopic parameters: height of the shower maximum (left), averaged “gammaness” (middle) and squared reconstructed distance to the source (right).
Current usage metrics show cumulative count of Article Views (full-text article views including HTML views, PDF and ePub downloads, according to the available data) and Abstracts Views on Vision4Press platform.
Data correspond to usage on the plateform after 2015. The current usage metrics is available 48-96 hours after online publication and is updated daily on week days.
Initial download of the metrics may take a while.