Fig. D.1

Download original image
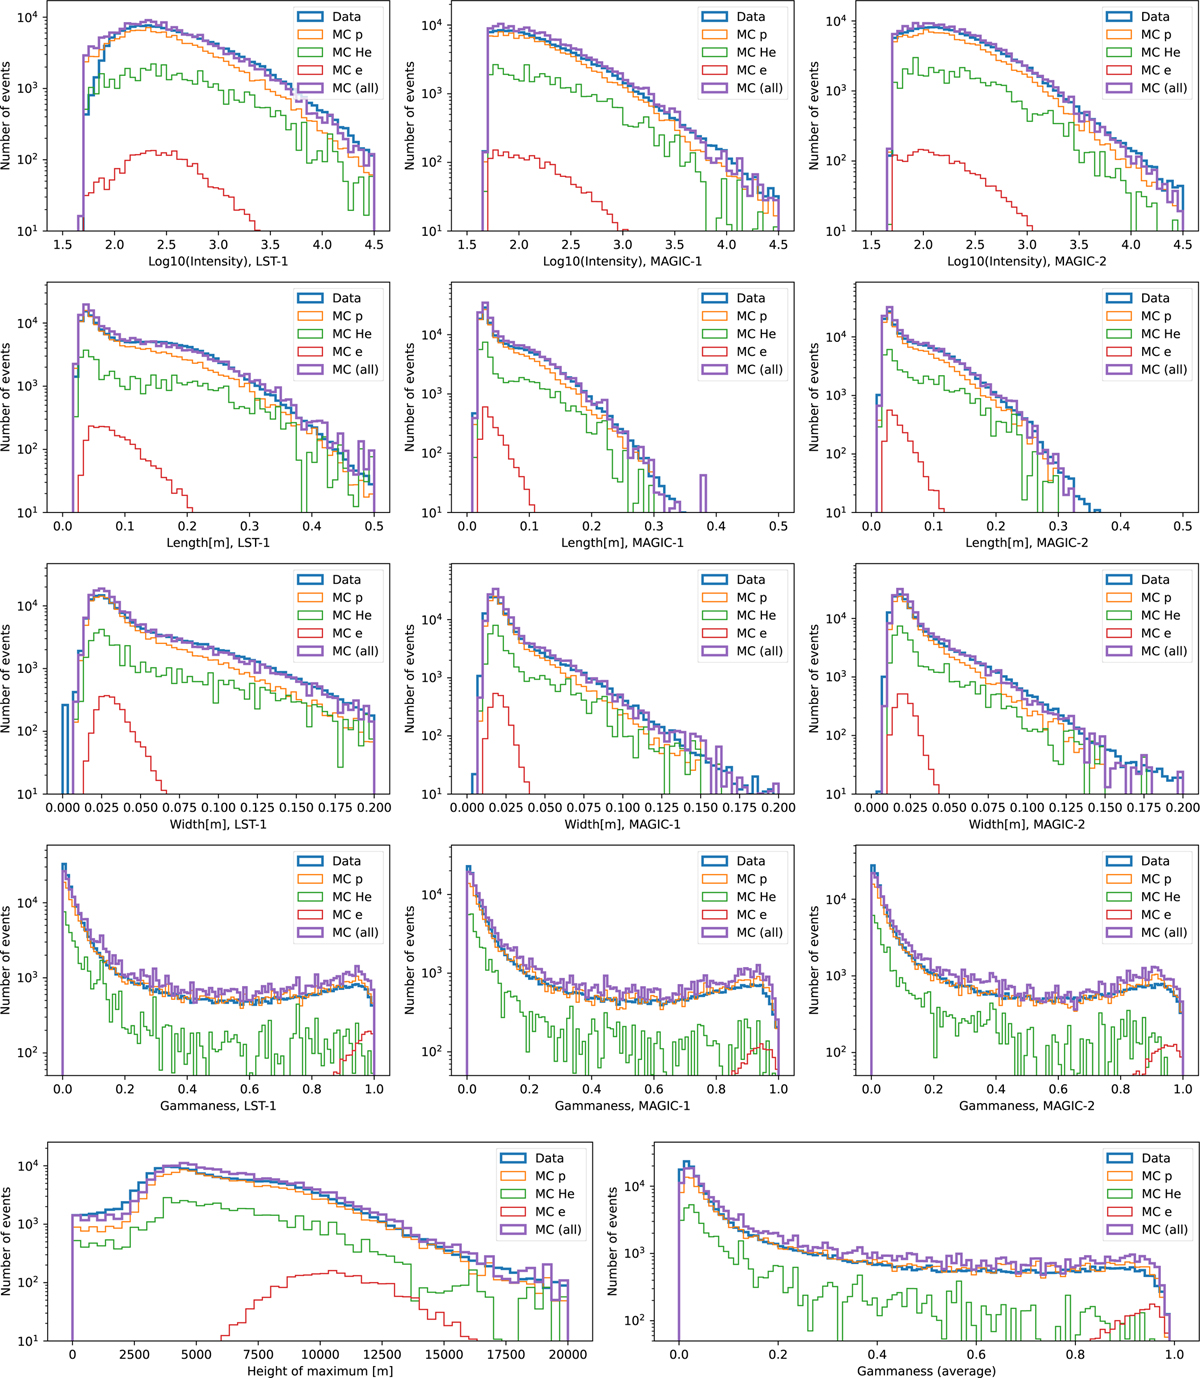
Comparison of image parameters between the Data and MC simulations (for zenith distance below 30°). Top four rows of panels show intensity, length, width, and individual telescope “gammaness” (from top to bottom) for LST-1 (left), MAGIC-I (middle) and MAGIC-II (right). The bottom row shows stereoscopic parameters: height of the shower maximum (left) and averaged “gammaness” (right). In all the panels: the thick blue line shows the data, while the thick magenta line shows the sum of all MC components. Thin lines show the individual components: protons (orange), helium (with an additional correction for heavier elements (green), and all-electrons (red).
Current usage metrics show cumulative count of Article Views (full-text article views including HTML views, PDF and ePub downloads, according to the available data) and Abstracts Views on Vision4Press platform.
Data correspond to usage on the plateform after 2015. The current usage metrics is available 48-96 hours after online publication and is updated daily on week days.
Initial download of the metrics may take a while.


