Fig. C.2
Download original image
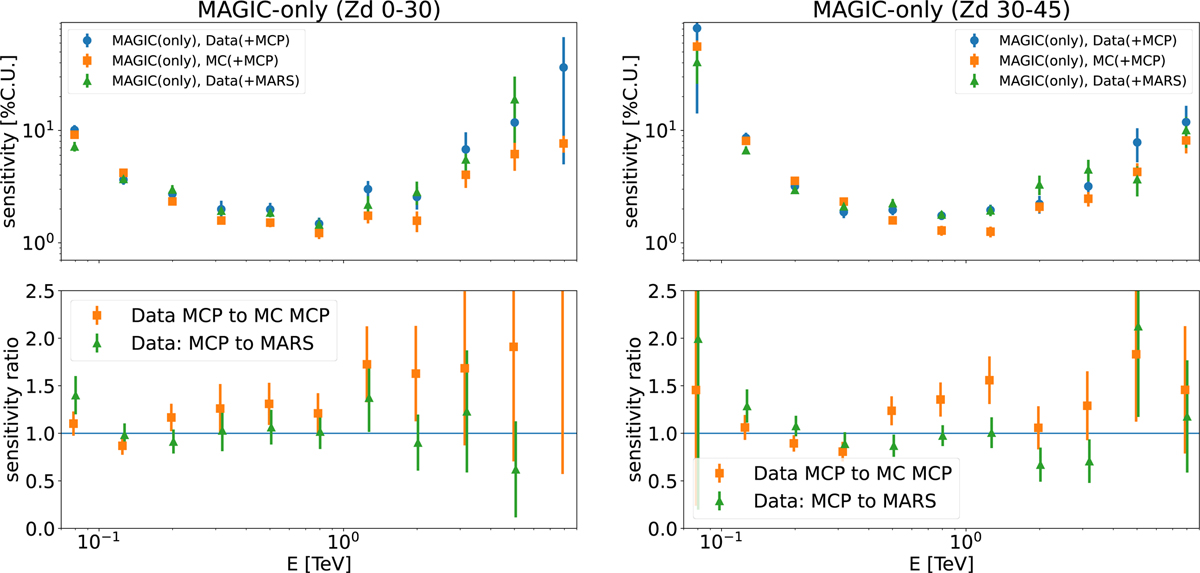
Differential sensitivity of MAGIC-only observations of MCP analysis chain (blue circles for data and orange squares for MC) compared with the standard MARS analysis over the same data sample (green triangles) for the low-zenith (left) and medium-zenith (right) cases. The bottom panel shows the sensitivity ratios (for visibility of uncertainty bars, the points are shifted in the X axis by ±1%).
Current usage metrics show cumulative count of Article Views (full-text article views including HTML views, PDF and ePub downloads, according to the available data) and Abstracts Views on Vision4Press platform.
Data correspond to usage on the plateform after 2015. The current usage metrics is available 48-96 hours after online publication and is updated daily on week days.
Initial download of the metrics may take a while.