Fig. 6.
Download original image
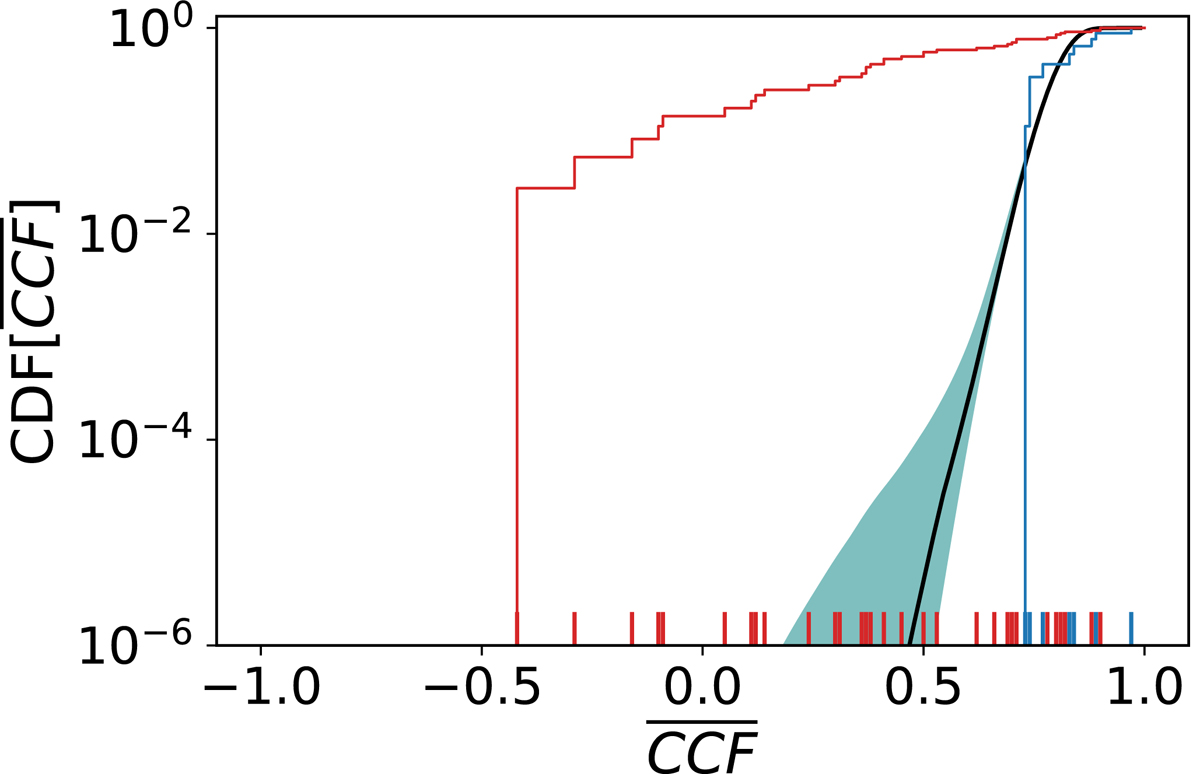
Normalised cumulative distribution of the observed single MBHs (blue histogram) and of our mock MBHBs (red histrogram). The solid black line shows the median cumulative probability that a system will have a ![]() of lower than a given value (obtained from the single MBH data under the assumptions specified in the main text). The teal band indicates the 90% credible region for the cumulative distribution of
of lower than a given value (obtained from the single MBH data under the assumptions specified in the main text). The teal band indicates the 90% credible region for the cumulative distribution of ![]() for single MBHs. The vertical red (blue) ticks highlight the
for single MBHs. The vertical red (blue) ticks highlight the ![]() values for all of the 36 mock binaries (9 single MBHs). The numerical values of all of the
values for all of the 36 mock binaries (9 single MBHs). The numerical values of all of the ![]() and cumulative probabilities are listed in Table 1.
and cumulative probabilities are listed in Table 1.
Current usage metrics show cumulative count of Article Views (full-text article views including HTML views, PDF and ePub downloads, according to the available data) and Abstracts Views on Vision4Press platform.
Data correspond to usage on the plateform after 2015. The current usage metrics is available 48-96 hours after online publication and is updated daily on week days.
Initial download of the metrics may take a while.