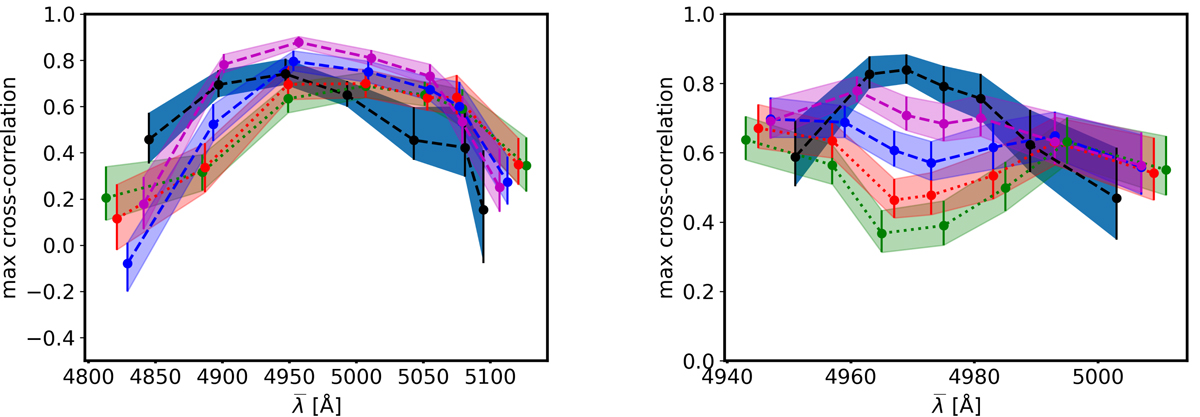
Fig. 5.
Download original image
Same as Fig. 4 but for NGC 5548 and the associated mock binaries (left panel) and for Mrk 202 (right panel). The case on the left represents a class of objects in which the max cross-correlation in the bulk of the broad line can be higher or lower than that of the single MBH depending on the assumed period. The right panel shows the only case in which the single MBH has a value of ![]() of higher than any of its sibling mock binaries, but the cross-correlation of the mocks can be quite high, up to ∼0.75 for the shortest period. Please note that the y-axis changes from panel to panel in order to emphasise the differences between the different cases.
of higher than any of its sibling mock binaries, but the cross-correlation of the mocks can be quite high, up to ∼0.75 for the shortest period. Please note that the y-axis changes from panel to panel in order to emphasise the differences between the different cases.
Current usage metrics show cumulative count of Article Views (full-text article views including HTML views, PDF and ePub downloads, according to the available data) and Abstracts Views on Vision4Press platform.
Data correspond to usage on the plateform after 2015. The current usage metrics is available 48-96 hours after online publication and is updated daily on week days.
Initial download of the metrics may take a while.