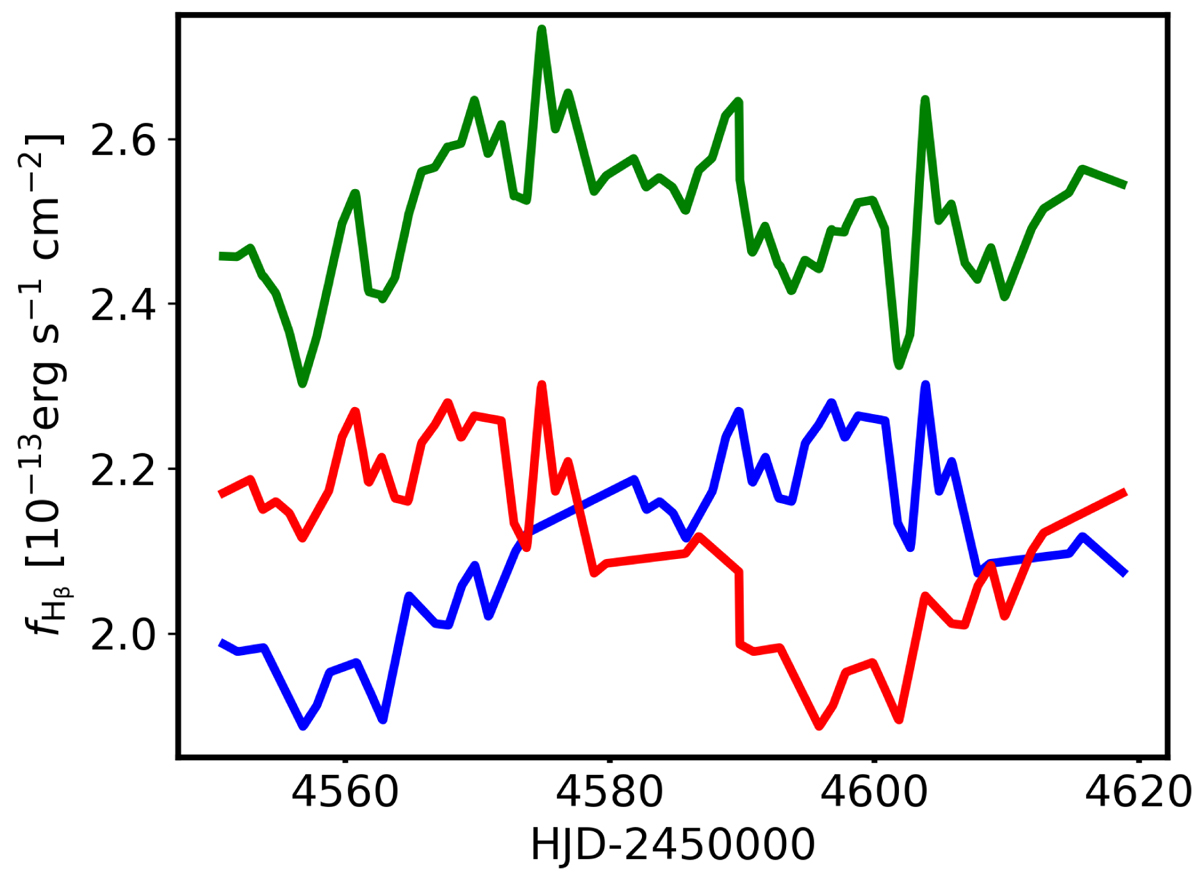
Fig. 2.
Download original image
NGC 4748: Original light curve of the entire Hβ line (blue line), the same light curve shifted by half of the observational period (with periodic boundary conditions, red line), and the sum of the two (rigidly shifted towards lower fluxes for visualisation purposes, green line), mimicking a MBHB whose components evolve independently on short timescales.
Current usage metrics show cumulative count of Article Views (full-text article views including HTML views, PDF and ePub downloads, according to the available data) and Abstracts Views on Vision4Press platform.
Data correspond to usage on the plateform after 2015. The current usage metrics is available 48-96 hours after online publication and is updated daily on week days.
Initial download of the metrics may take a while.