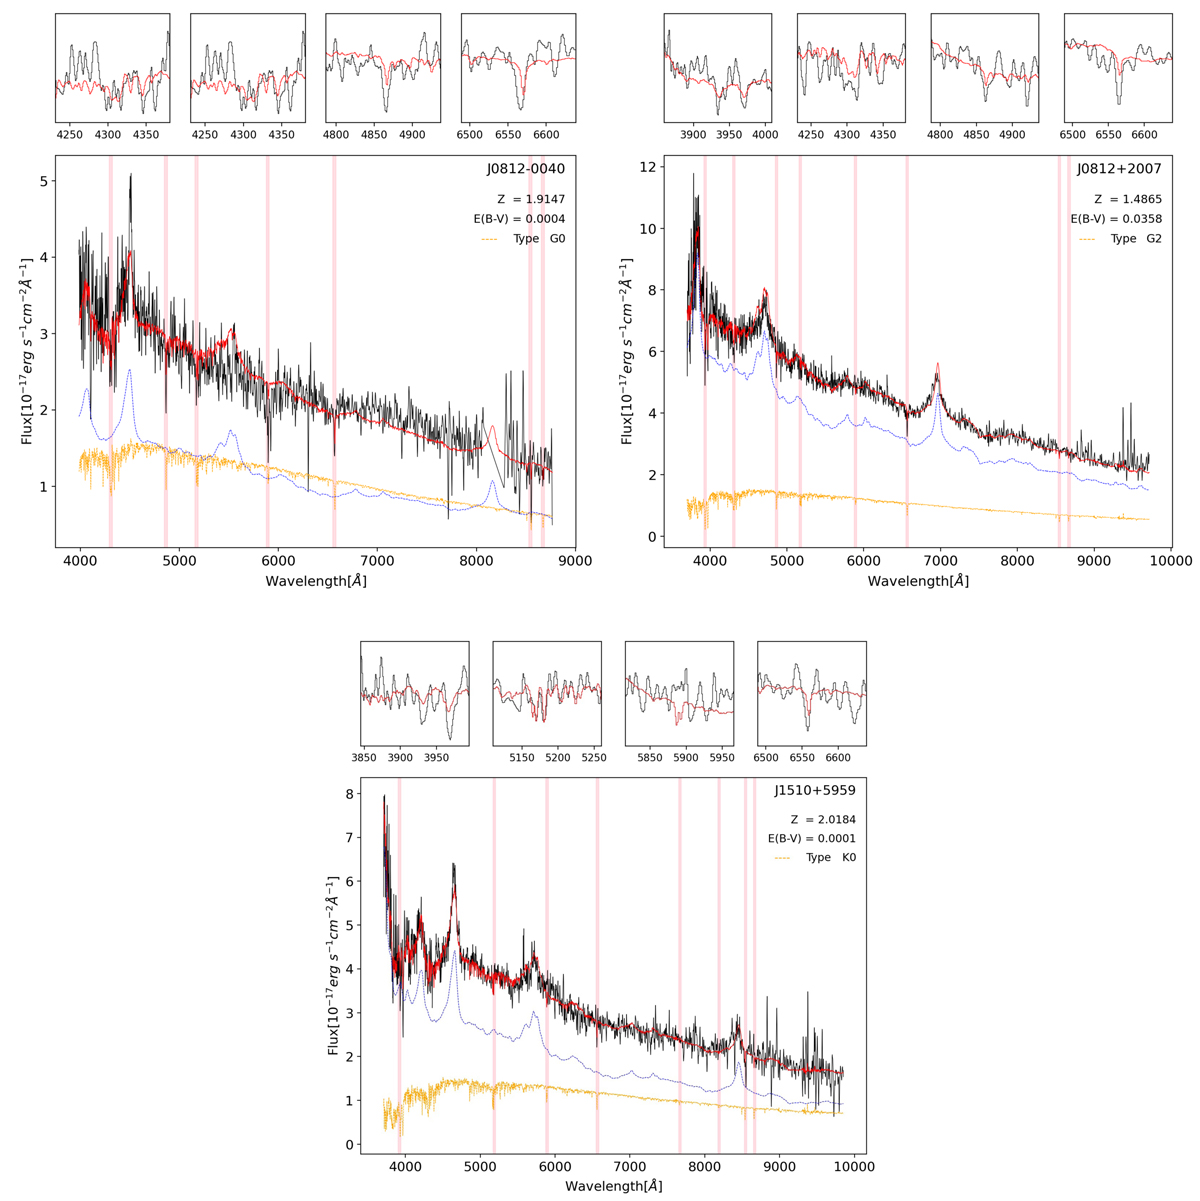
Fig. A.2.
Download original image
Spectral deconvolution of the systems that are best reproduced by a combination of an AGN and a star. The observed spectra are shown in black, the best fit is plotted in red, the QSO is shown in blue, and the stellar component is shown in orange, with vertical red stripes around the main stellar absorption features of the best-fitting stellar type. The four small panels above the main panels are enlargements of the main absorption features of the stellar companion.
Current usage metrics show cumulative count of Article Views (full-text article views including HTML views, PDF and ePub downloads, according to the available data) and Abstracts Views on Vision4Press platform.
Data correspond to usage on the plateform after 2015. The current usage metrics is available 48-96 hours after online publication and is updated daily on week days.
Initial download of the metrics may take a while.