Open Access
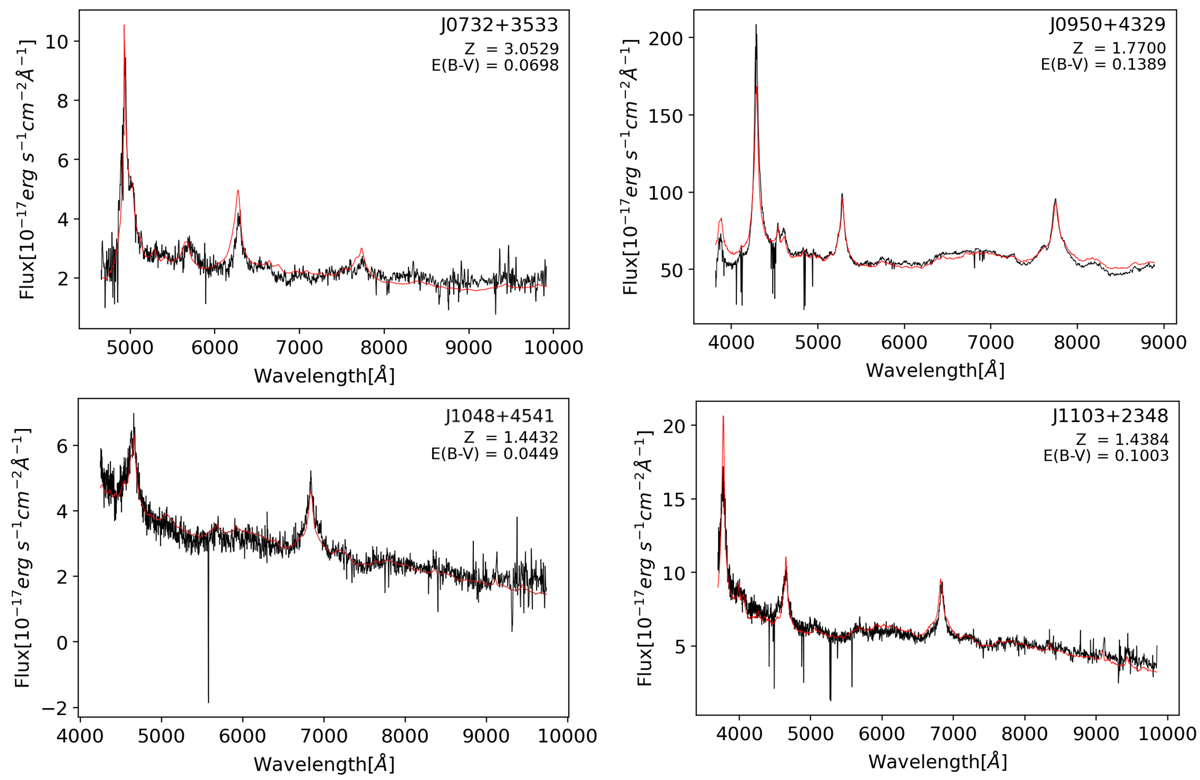
Fig. A.1.
Download original image
Spectral deconvolution of the objects that are best reproduced by an AGN spectrum. The observed spectrum is shown in black, and the best fit is plotted in red. Each panel reports the target ID and the best-fitting redshift and degree of dust extinction.
Current usage metrics show cumulative count of Article Views (full-text article views including HTML views, PDF and ePub downloads, according to the available data) and Abstracts Views on Vision4Press platform.
Data correspond to usage on the plateform after 2015. The current usage metrics is available 48-96 hours after online publication and is updated daily on week days.
Initial download of the metrics may take a while.