Fig. 3.
Download original image
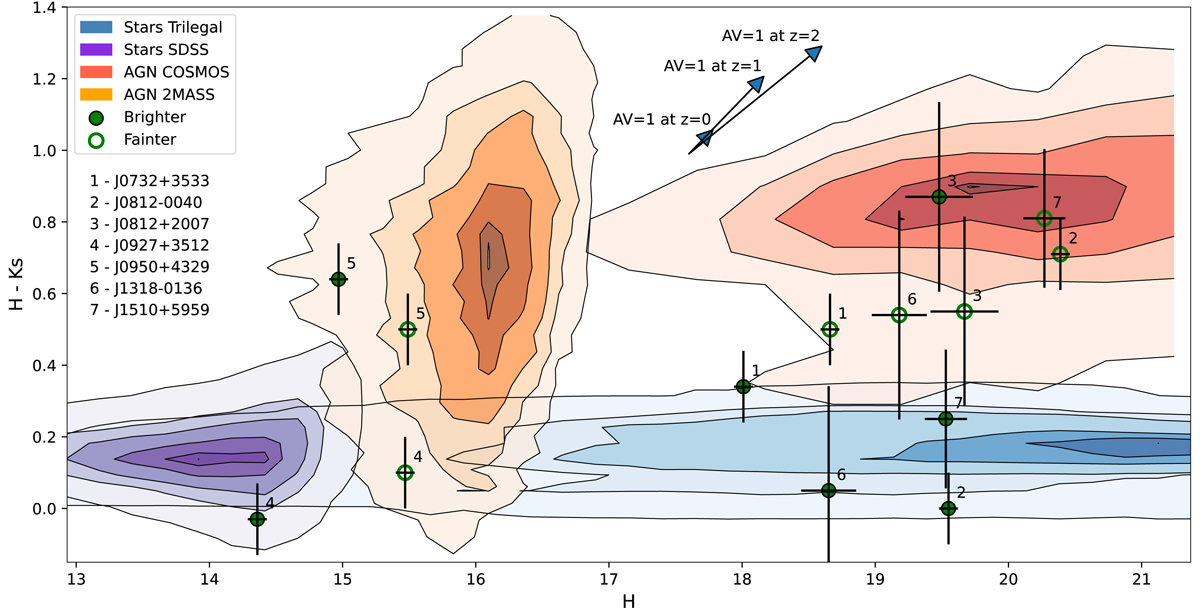
Near-IR colors and magnitudes of the observed targets. The blue and purple contour plots show the distribution of Galactic stars from the TRILEGAL model (Girardi et al. 2005) and from the SDSS, respectively, while orange and red contours show AGNs from SDSS DR16Q (Lyke et al. 2020) and COSMOS (Civano et al. 2016), respectively.
Current usage metrics show cumulative count of Article Views (full-text article views including HTML views, PDF and ePub downloads, according to the available data) and Abstracts Views on Vision4Press platform.
Data correspond to usage on the plateform after 2015. The current usage metrics is available 48-96 hours after online publication and is updated daily on week days.
Initial download of the metrics may take a while.