Fig. 1.
Download original image
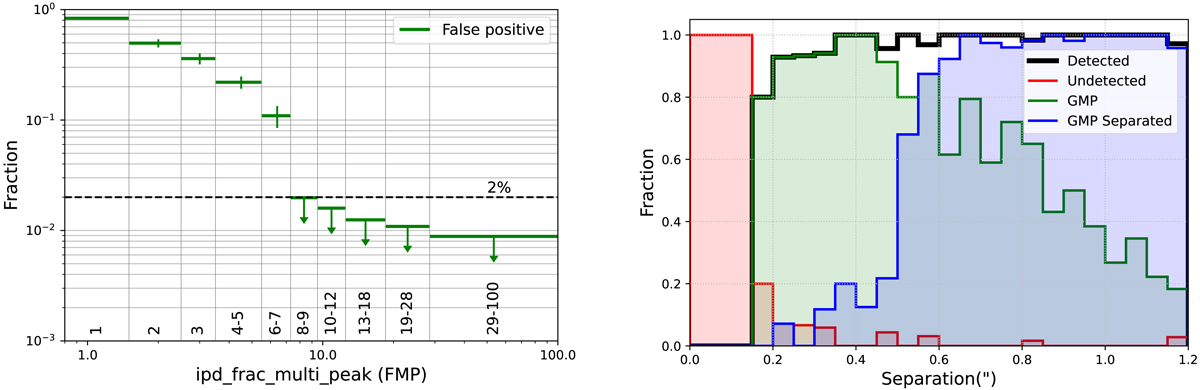
Statistical properties of the GMP selection. Left: level of contamination of false positives (objects with a detection of multiple peaks that are not projected pairs) as a function of the FMP values in a sample of dense stellar fields for G < 20.5. No false positives are found for FMP ≥ 8, where we plot 90% upper limits, i.e., the levels that would correspond to 2.3 false positives. Right: fraction of recovered projected pairs as a function of separation (δ) in arcseconds. The red histogram shows the pairs that are not recovered, which dominate the counts at δ < 0.15″ and are very rare at δ > 0.20″. The green histogram reports the fraction of recovered isolated objects that correspond to single entries in the Gaia source catalog, and the blue histogram shows the GMP-selected objects that have nearby companions in the catalog. The combination of these two GMP populations is show by the black line.
Current usage metrics show cumulative count of Article Views (full-text article views including HTML views, PDF and ePub downloads, according to the available data) and Abstracts Views on Vision4Press platform.
Data correspond to usage on the plateform after 2015. The current usage metrics is available 48-96 hours after online publication and is updated daily on week days.
Initial download of the metrics may take a while.