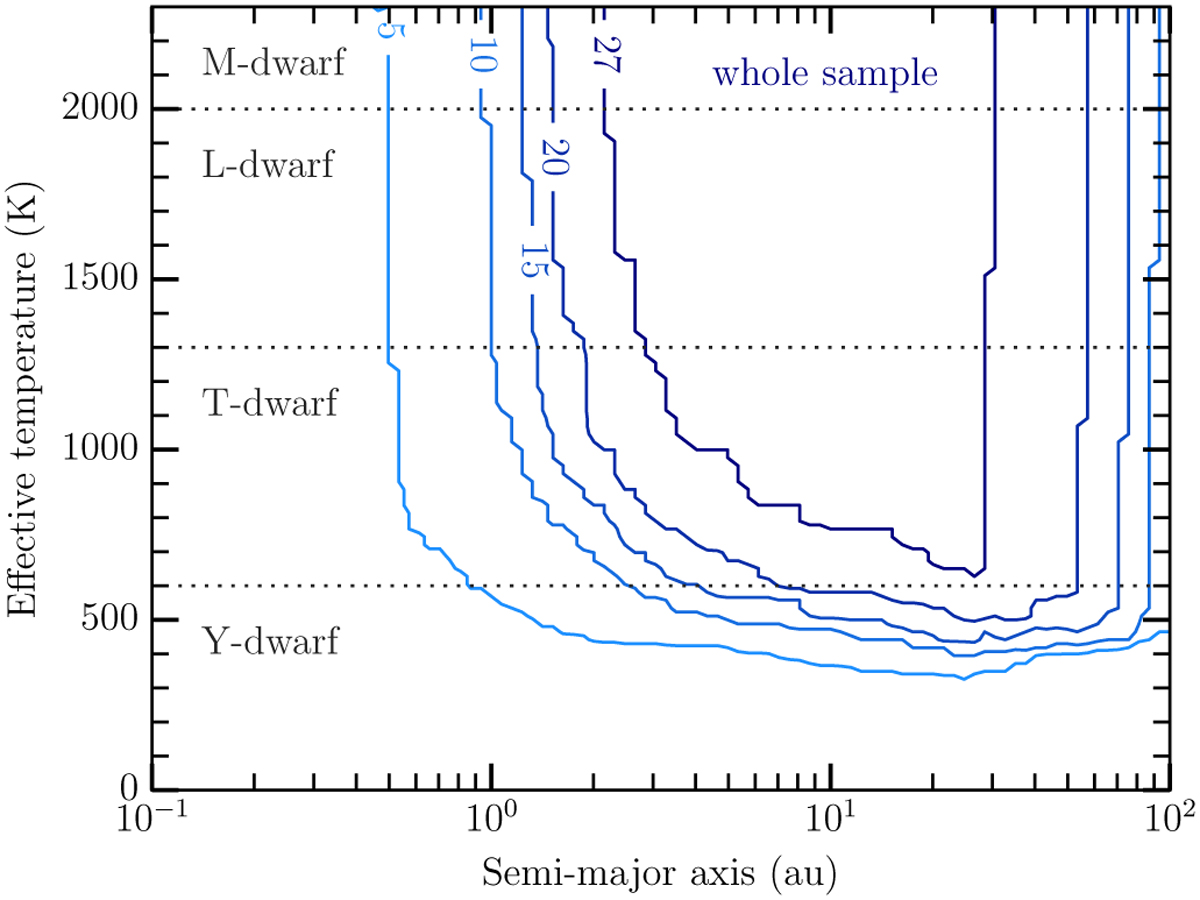
Fig. 8
Download original image
Sensitivity for our direct imaging survey. The isocontours give the number of stars that have the sensitivity to detect companions at a probability of 50% for this given semi-major axis and effective temperature. The dotted lines represent the indicative effective temperatures of the transitions between Y and T-dwarfs (~600 K), T and L-dwarfs (~300 K), L and M-dwarfs (~2000 K).
Current usage metrics show cumulative count of Article Views (full-text article views including HTML views, PDF and ePub downloads, according to the available data) and Abstracts Views on Vision4Press platform.
Data correspond to usage on the plateform after 2015. The current usage metrics is available 48-96 hours after online publication and is updated daily on week days.
Initial download of the metrics may take a while.