Fig. 7
Download original image
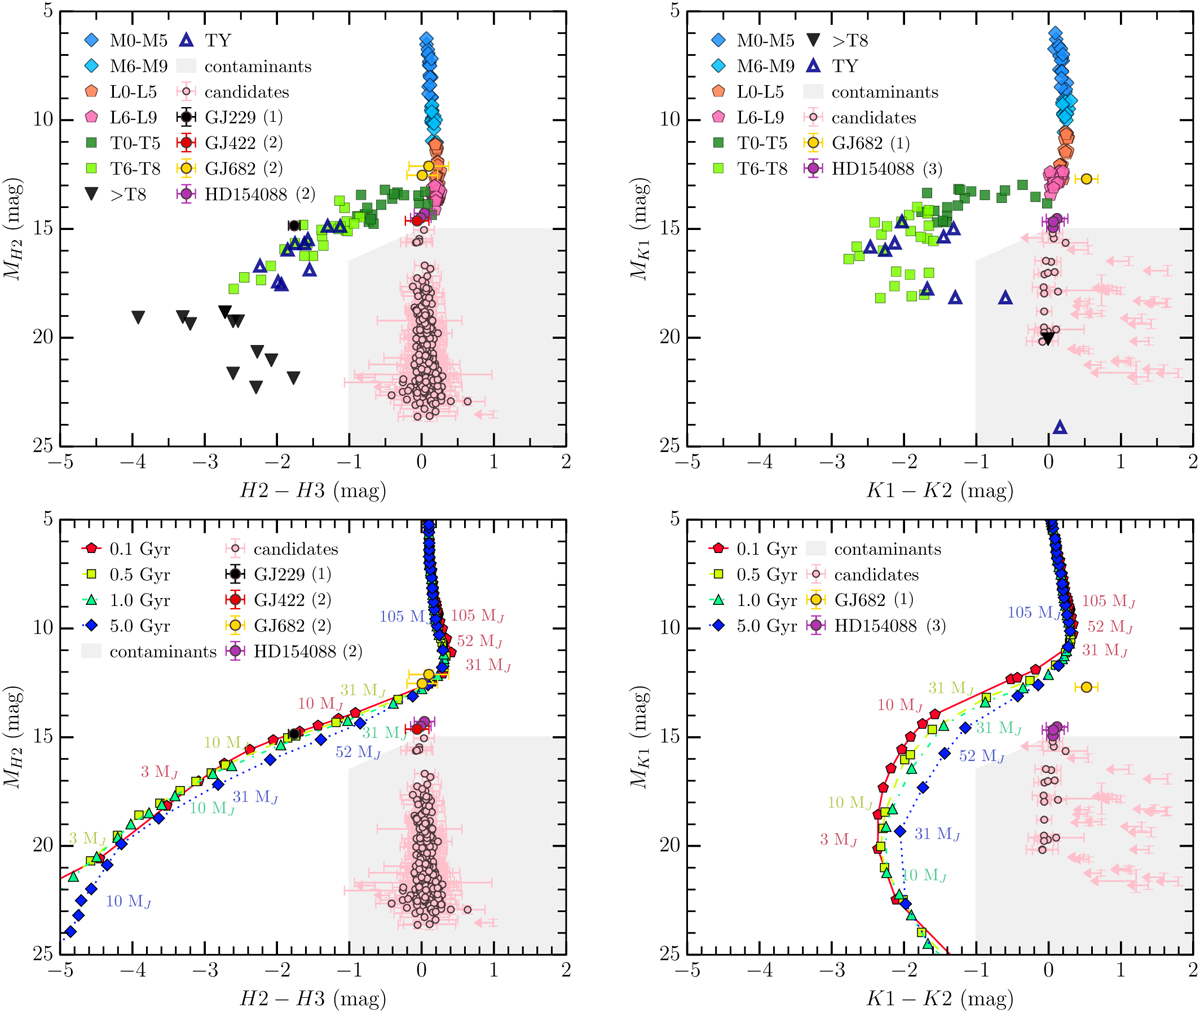
Color Magnitude Diagram in the band H23 (left) and K12 (right) for all the point sources detected in the H2 and/or K1 band over the whole survey. Top panel: the sequence of known giant planets and brown dwarfs of different spectral types is shown (the photometry from MLTY brown dwarfs is taken from https://cass.ucsd.edu/~ajb/browndwarfs/spexprism/index.html). Bottom panel: isochrones from the evolutionary models COND (Baraffe et al. 2003) are plotted for different object masses.
Current usage metrics show cumulative count of Article Views (full-text article views including HTML views, PDF and ePub downloads, according to the available data) and Abstracts Views on Vision4Press platform.
Data correspond to usage on the plateform after 2015. The current usage metrics is available 48-96 hours after online publication and is updated daily on week days.
Initial download of the metrics may take a while.